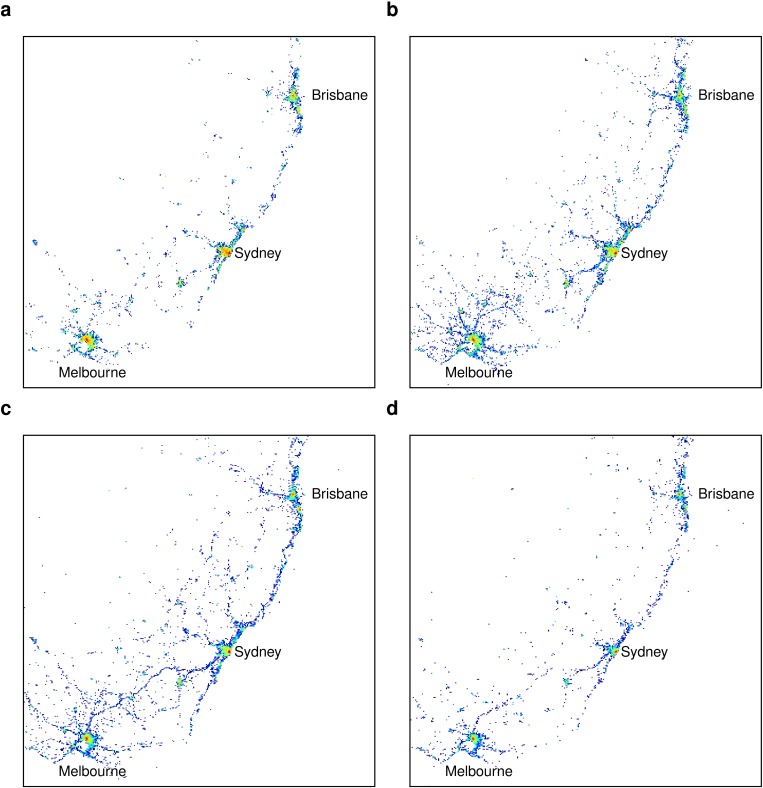
Fig 6. Differences in tweet spatial distributions as the radius of gyration varies: (a) 1–10 km; (b) 10–100 km; (c) 100–500 km; (d) > 500 km.
The maps focus on the southeast region in Australia that accounts for nearly half the population. Tweet activity for 1 < r g < 10 and 500 < r g < 1000 is mainly concentrated in large cities, while tweets for intermediate r g extend further along main highways and other regions between cities.

