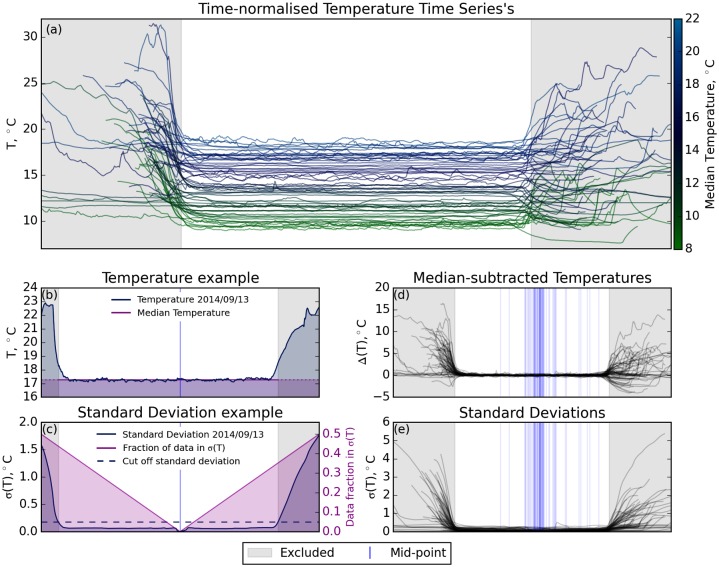
Fig 3. Processing method for the temperature data (denoted in the figure as T) acquired by the surfer.
Figures (a), (d) and (e) were normalised such that the start (surfer entered the water and sensor equalised to water temperature) and end (surfer exited the water and sensor beginning to respond to air temperature) is at the same point on the graph (x-axis) for each session. (a) A superposition of all the temperature data acquired by the surfer during the study period at Wembury beach. (b) A typical temperature data set, acquired on the 13th September 2014, showing the start and stop time of the surf (vertical grey lines), mid-point of data collection (blue line), excluded data (grey shaded areas) and the median of the data collected in the sea (considered as the SST). (c) Standard deviations computed using the processing method for data collected on 13th September 2014, with the corresponding fraction of data used to calculate the standard deviations and the 10% threshold used to exclude data collected when the surfer was on land. (d) Shows the temperature of each session presented as in Fig 3a, but with the computed SST (median of remaining data) subtracted. (e) A superposition of the standard deviations for the data collected at Wembury beach.

