
Fig 6. Level of (a.) home cage activity and (b.) stereotypic behaviour in both handling groups.
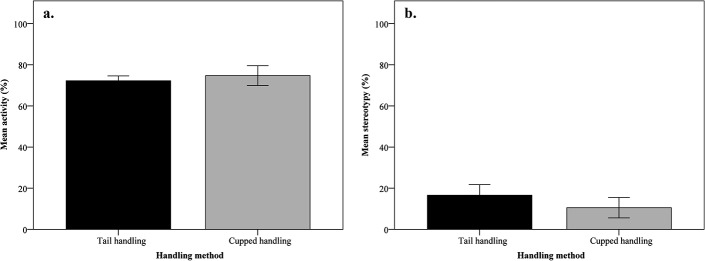
Home cage activity is presented as proportion of observed time and stereotypic behaviour as proportion of active time, mean ± SEM.
Official websites use .gov
A
.gov website belongs to an official
government organization in the United States.
Secure .gov websites use HTTPS
A lock (
) or https:// means you've safely
connected to the .gov website. Share sensitive
information only on official, secure websites.
Home cage activity is presented as proportion of observed time and stereotypic behaviour as proportion of active time, mean ± SEM.