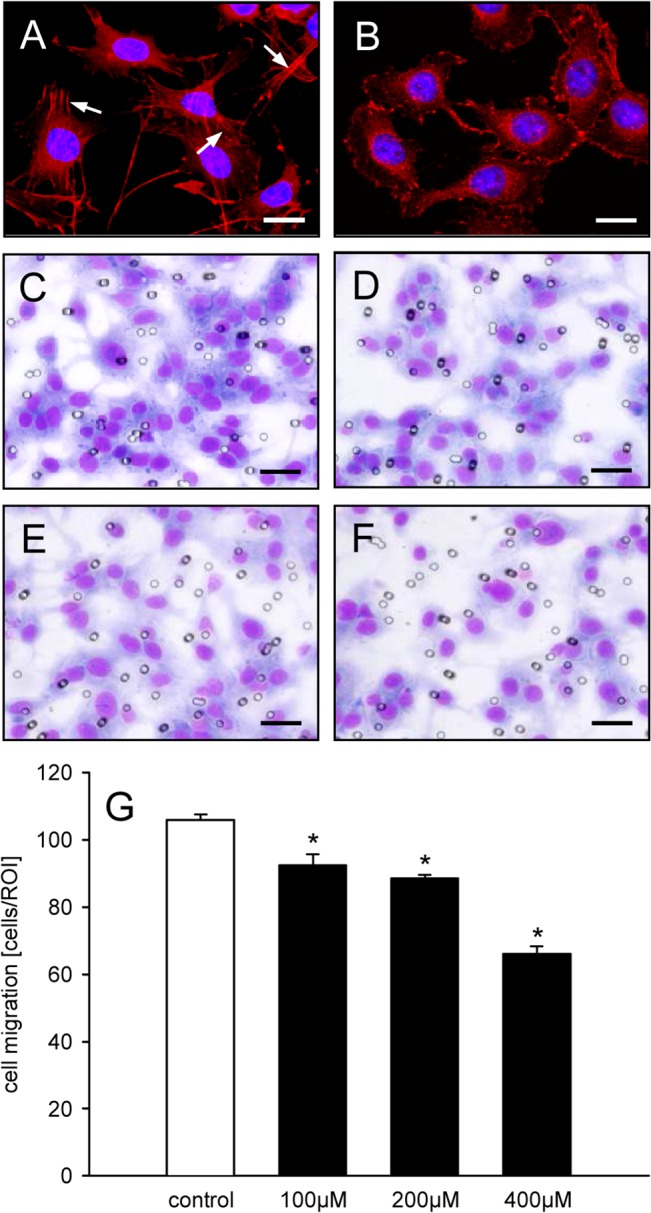
Fig 3. Geraniol action on stress fiber formation and cell migration.

A, B: Fluorescence microscopic images of eEND2 cells, which were exposed for 24h to vehicle (A) or 400μM geraniol (B). The cells were stained with Alexa Fluor 568-conjugated phalloidin (red) for the detection of the cytoskeleton. The cell nuclei were stained with Hoechst 33342 (blue). Note that in contrast to the geraniol-treated cells (B) many of the vehicle-treated cells exhibit typical actin stress fibers (A, arrows). Scale bars: 30μm. C-F: Light microscopic images of eEND2 cells, which have migrated through the 8μm pores of the PET filters of the transwell migration assay to the lower membrane surface. The cells were exposed for 24h to vehicle (C), 100μM (D), 200μM (E) or 400μM geraniol (F) and visualized by Diff-Quick staining. Scale bars: 70μm. G: Cell migration (cells/ROI) of eEND2 cells, which were exposed for 24h to different doses (100–400μM; n = 4) of geraniol or vehicle (control; n = 4), as assessed by the transwell migration assay. Means ± SEM. *P<0.05 vs. control.
