
Fig 1. Principal component analysis of Jersey cattle using ROH (A) and SNP genotypes (B).
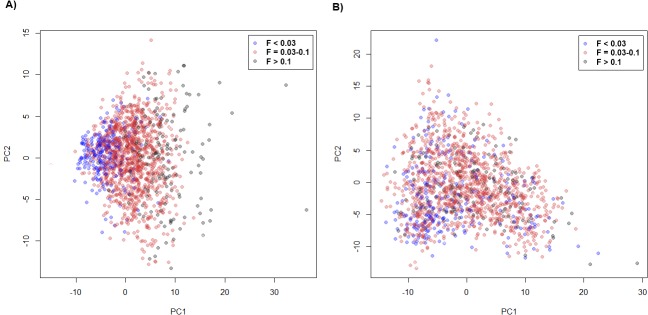
Principal component 1 (PC1, x axis) and principal component 2 (PC2, y axis) are plotted. Three groups that are classified based on inbreeding coefficient (FPED) are indicated with three different colors. Blue, red, and black circles represent individuals with FPED<0.03, FPED = 0.03–0.10, and FPED>0.10, respectively.