Figure 2.

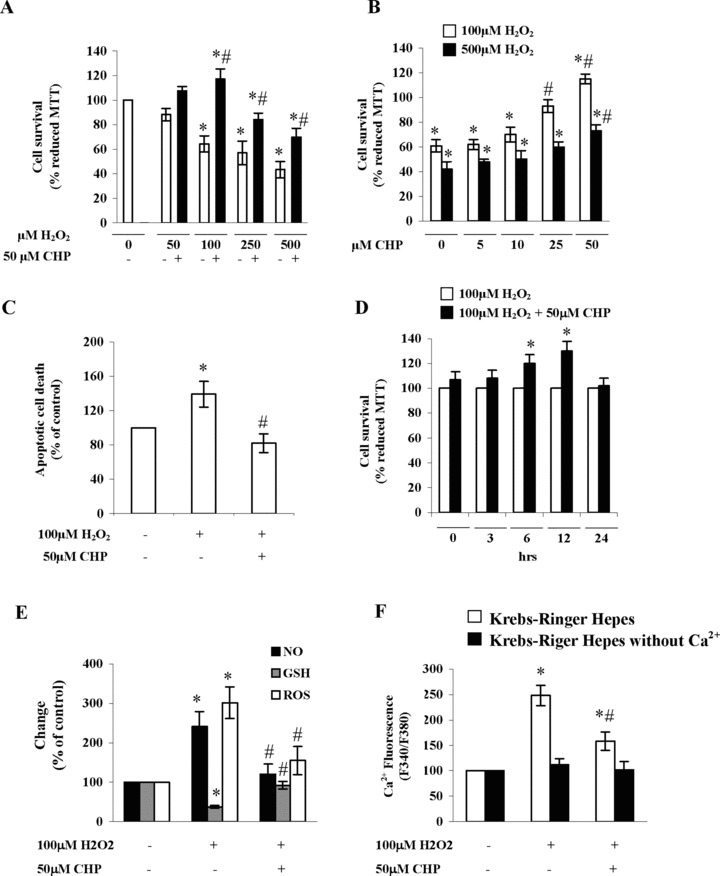
Cyclo(His-Pro) protects PC12 cells against H2O2-induced apoptotic death, oxidative/nitrosative stress and calcium accumulation. (A) PC12 cells were incubated with 50 μM cyclo(His-Pro) for 24 hrs, then H2O2 was added at the indicated concentrations and the analyses performed as described. Reduced MTT data in control cells (absorbance at 550 nm = 1.66 ± 0.2) were considered as 100%. Results are expressed as the mean ± S.D. (n= 8). *P< 0.05 versus control; #P< 0.05 versus H2O2-treated cells. (B) PC12 cells were incubated with increasing cyclo(His-Pro) concentrations for 24 hrs, then 100 μM or 500 μM H2O2 were added and the analyses performed as described. Results are expressed as the mean ± S.D. (n= 8). *P< 0.05 versus control cells (100 μM H2O2); #P< 0.05 versus control cells (500 μM H2O2). (C) PC12 cells were incubated with 50 μM cyclo(His-Pro) for 24 hrs, then 100 (jlM H2O2 was added and condensed and/fragmented nuclei were determined by Hoechst staining and expressed as percentages of control (no treatment). Results are given as the mean ± S.D. (n= 8). *P< 0.05 versus control; #P< 0.05 versus H2O2-treated cells. (D). PC12 cells were treated with 100 (jlM H2O2, then 50 μM cyclo(His-Pro) was added after the indicated time intervals. Reduced MTT data in H2O2-treated cells were considered as 100%. Results are expressed as the mean ± S.D. (n= 5). *P< 0.05 versus H2O2-treated cells. (E) Cells were incubated with 50 μM cyclo(His-Pro) for 24 hrs, then 100 μM of H2O2 was added and the analyses performed as described. Values (mean ± S.D., n = 7), given as percentages of control (no treatment; considered as 100%), were: NO (absorbance values at 550 nm): 0.8 ± 0.02; glutathione (GSH, in μM): 4.5 ± 0.1; ROS (DCF fluorescence): 0.9 ± 0.2; *P< 0.05 versus control; #P< 0.05 versus H2O2-treated cells. (F) Cells were incubated for 24 hrs either in the absence or in the presence of 50 |jJM cyclo(His-Pro), loaded with 3 μM Fura-2/AM in Krebs-Ringer HEPES (KRH), and incubated with 100 μM H2O2. Intracellular Ca2+ was measured by Fura-2/AM F340/F380 fluorescence ratio. Data are presented as mean ± S.D., (n= 5). *P< 0.05 versus control; #P< 0.05 versus H2O2-treated cells.
