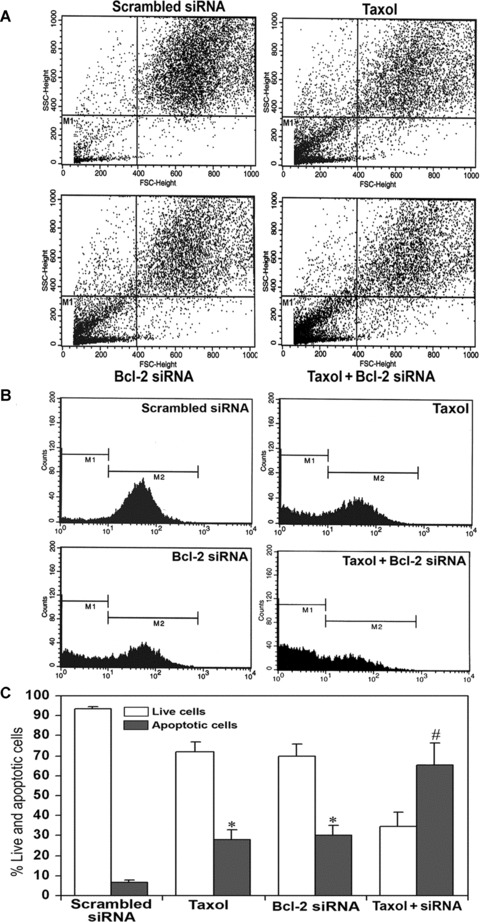
Fig 2.

FACS analysis for detection of apoptotic cells and DNA fragmentation. Treatment (72 hrs) of cells: transfection with a plasmid vector expressing scrambled siRNA (treated control), 100 nM taxol, transfection with a plasmid vector expressing Bcl-2 siRNA and taxol + Bcl-2 siRNA. (A) FACS dot plots of U251MG cells. Before FACS analysis, the cells were treated with 50 μg/ml propidium iodide for 30 min. at 4°C in dark. Population in the M1 area represents the apoptotic/dead cells. (B) FACS histograms of U251MG cells. The prominent increase in population of cells in the sub-G1 phase (M1) indicated increase in apoptosis after treatment with taxol or Bcl-2 siRNA or both. (C) Quantitative presentation of DNA fragmentation data from FACS analysis to indicate percent changes in live and apoptotic cells. Data are representative of four independent experiments (*P < 0.001 when compared with scrambled siRNA treatment mean values and #P < 0.001 when compared with taxol or Bcl-2 siRNA treatment mean values).
