Figure 5.

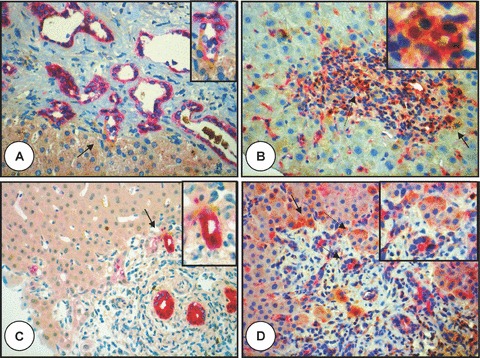
Polyductin expression and co-staining. (A) Microphotograph of the liver specimen with Caroli’s disease (stage: cirrhosis) showing a moderate to intense Ep-CAM staining of the biliary epithelium and focal co-staining with FP2 (arrow) at the limiting plate of the portal tract (anti-FP2 brown, anti-Ep-CAM red, ×400; the biliary structure indicated by the arrow is also shown in the inset); in (B) is shown a portal tract from a liver specimen with chronic rejection and paucity of the interlobular bile ducts (bile duct to portal tract ratio: 0.3) showing a portal tract with a residual bile duct and CK-19 staining of the bile duct epithelium and more co-staining at the limiting plate and in some biliary structures (orange staining, arrow) (anti-FP2 brown, anti-CK19 red, ×400). The segmented arrow shows a biliary duct with co-staining (also shown in the inset); in (C) co-CK19 and FP2 staining (arrow) is shown in the limiting plate of this portal tract from a liver specimen with acute rejection (anti-FP2 brown, anti-CK19 red, ×400; in the inset is the biliary structure shown by the arrow); in (D) is also shown the portal tract of a liver specimen with acute rejection showing some FP2 staining (brown) and co-staining of ductal plate cells (arrow with solid line) and biliary structures with MUC-1 (arrows with segmented lines, also demonstrated in the inset) (anti-FP2 brown, anti-MUC-1 red, ×400).
