
Figure 5.
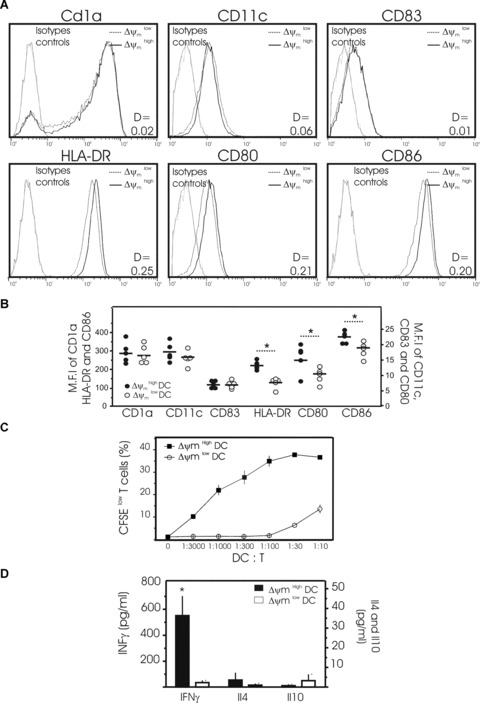
Phenotypic and functional properties of DCs as a function of their Δψm. (A) Representative histograms showing the surface expression of CD1a, CD11c, CD83, HLA-DR, CD80 and CD86 on two subpopulations of mature DCs obtained from one donor: DCs with high Δψm (black line) and DCs with low Δψm (dotted line) (isotype controls = grey lines). Mature DCs were cultured for 48 hrs then harvested for the simultaneous determination of surface markers and Δψm using the potentiometric dye CMX-ROS. Dead cells and debris were gated out according to their forward-angle and right-angle light scattering properties. One of 4 independent experiments is presented. D values by Kolmogorov–Smirnov analysis between Δψm high and low subpopulations of DCs are shown. (B) Pooled data depicting the expression (MFI) of CD1a, CD11c, CD83, HLA-DR, CD80 and CD86 by Δψm high and low subpopulations of DCs as in (A) (Data are from five separate donors, circles represent single individuals and horizontal bars represent group mean values. *P < 0.05 between the two groups). (C, D) Allo-stimulatory capacity of mature Δψm high and Δψm low DCs in activating allo-reactive T cells in an MLR assay. After 48 hrs of culture, mature DCs were stained with CMX-ROS and YOPRO and subpopulations of viable DCs with high Δψm and low Δψm sorted flow cytometrically. Then a graded number of Δψm high or Δψm low DCs were co-cultured with allogeneic, naïve CD4+ T cells stained with CFSE. (C) After 5 days of co-culture, T-cell proliferation was determined by the percentage of CFSE low cells. The typical representation of proliferation curves determined at a different stimulator:responder ratio ranging from 1:3000 to 1:10 (DC:T) is shown. Three independent experiments gave similar results. (D) The secretion of IFNγ, IL4 and IL10 was measured by ELISA in the supernatants of T cells cultured for 5 days with viable Δψm high DCs (solid bar) or viable Δψm low DCs (open bar) sorted flow cytometrically (ratio 1 DC:10 T). Mean ± S.D. of three independent experiments with separate donors is shown. (*P < 0.05 between the two subpopulations).