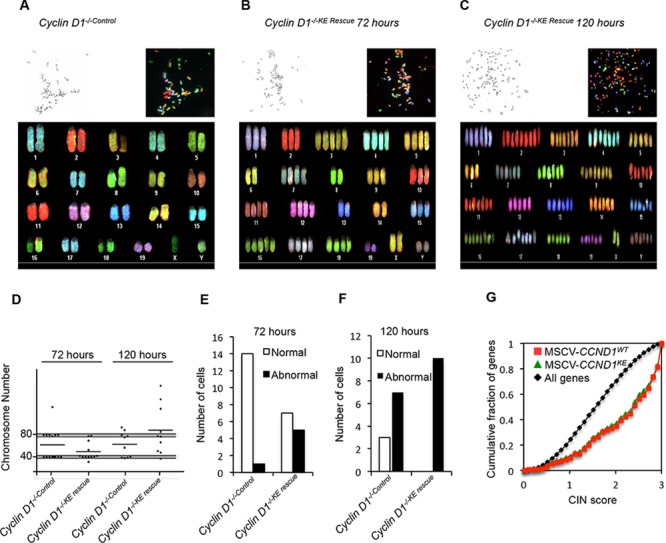
Figure 2. Cyclin D1 kinase-independent induction of aneuploidy.

Representative metaphases from spectral karyotyping (SKY) on MEFs of cyclin D1−/−Control at 72 hours (P6) (A), cyclin D1−/−KE Rescue at 72 hours (P6) (B) and cyclin D1−/−KE Rescue at 120 hours (C). Each panel contains the following images: inverted 4′,6-diamidino-2-phenylindole (DAPI) image of the metaphase (top left corner), raw spectral image of the metaphase (top right) and classified metaphase of the same metaphase (lower panel). (D) Scatter plots of chromosomal number across metaphase spreads from cyclin D1−/−Control and cyclin D1−/−KE Rescue cells showing the total number of chromosomes at 72 hours and 120 hours from cells with the noted genotype. The grey shaded bar represents expected deviation from normal at 2N and 4N (+/– 2 chromosomes). Applying the chi-square test of association by comparing cyclin D1−/− versus the cyclin D1−/−D1 Rescue MEFs, and cyclin D1−/−KE Rescue cells yields p < 0.001. (E and F) Bar graphs showing the number of normal and abnormal karyotypes comparing cyclin D1−/−Control and cyclin D1−/−KE Rescue at 72 hours and 120 hours post transduction. (G) An expression profile for cyclin D1−/−D1 Rescue (red line) and cyclin D1−/−KE Rescue (green line) induced genes [16] enriched for high CIN score (p < 0.0001).
