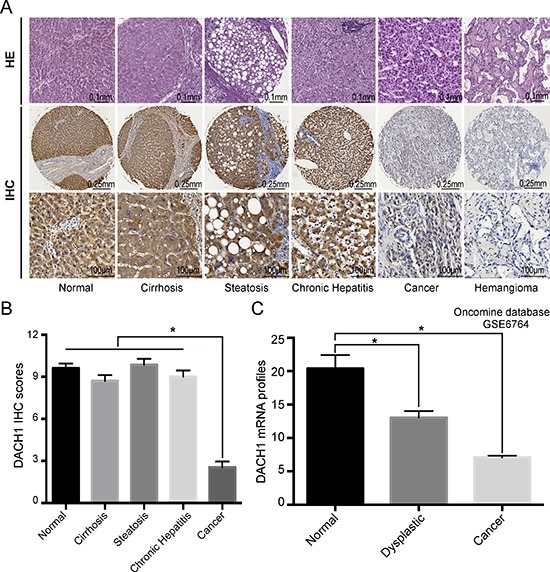
Figure 1. Combined analyses of DACH1 in liver benign and malignant lesions.

Representative images of DACH1 expression in different lesions of liver were shown (A) with semi quantitative result displayed as mean ± SE (B). Oncomine database analysis showed the mRNA level of DACH1 in normal and cancer tissues (C).
