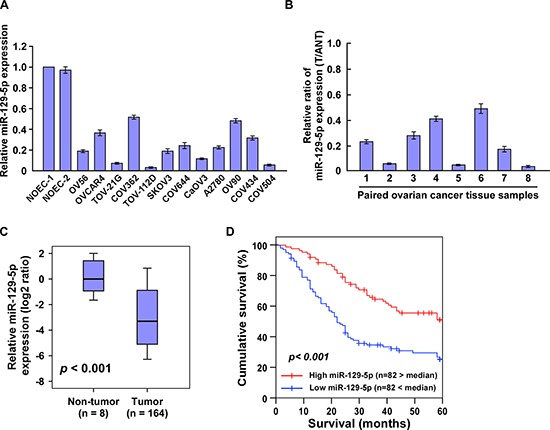
Figure 6. Downregulation of miR-129-5p correlates with ovarian cancer progression.

(A and B) Real-time PCR analysis of miR-129-5p expression in (A) two NOEC (normal ovarian epithelial cell) lines and 12 cultured ovarian cancer cell lines, and (B) eight pairs of ovarian cancer samples (T) and adjacent normal ovary tissues (ANT). Transcript levels were normalized to U6 expression. (C) MiR-129-5p expression in 164 ovarian cancer samples and eight normal ovarian tissues assessed by real-time PCR. Transcript levels were normalized to U6 expression. Boundaries of boxes represent lower and upper quartiles, respectively. Lines within boxes and whiskers denote median and extremum, respectively. (D) Kaplan–Meier analysis of 5-year overall survival curves of ovarian cancer patients with low miR-129-5p expression (< median, n = 82) or high miR-129-5p expression (> median, n = 82). Each bar represents the mean ± SD of three independent experiments. *p < 0.05.
