
Figure 1. Basal expression levels of CD44 in breast cancer cell lines and mammosphere formation.
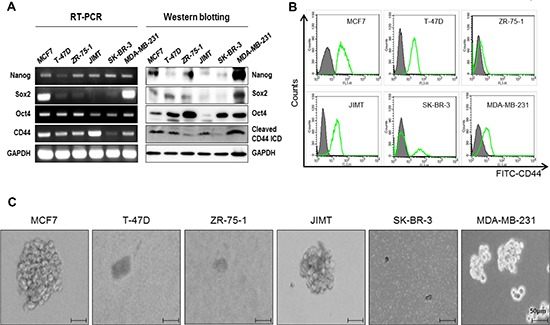
(A) The basal expression levels of Nanog, Sox2, Oct4, and CD44 were detected with an RT-PCR (left panel) and western blot (right panel) analysis, respectively. GAPDH was used as a loading control. (B) CD44 levels were measured using a FACs analysis. (C) The mammosphere forming ability was measured under sphere forming conditions for 15 days as described in “materials methods”. All experiments were performed in the indicated breast cancer cell lines.