
Figure 4. TRPM7 drives mouse and human neuroblastoma cell migration.
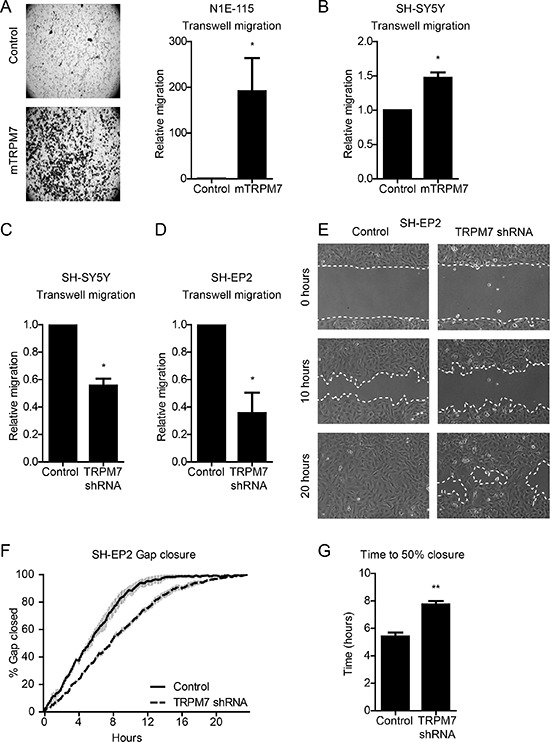
(A) & (B) Transwell migration of N1E-115 (n = 6) and SH-SY5Y (n = 3) control and mTRPM7 overexpressing cells. Equal numbers of cells were allowed to migrate towards a serum gradient for 48 hours. Data are normalized to control and represent mean ± SEM of n > 3 independent experiments performed in duplicate. (C) & (D) Transwell migration of SH-SH5Y and SH-EP2 control and TRPM7 shRNA cells. Equal numbers of SH-SY5Y and SH-EP2 cells were allowed to migrate towards a serum gradient for 48 and 24 hours respectively. Data are normalized to control and represent mean ± SEM of n = 3 independent experiments performed in duplicate. (E) Representative images of gap closure by SH-EP2 control and TRPM7 shRNA cells at time points 0, 10 and 20 hours. (F) Gap closure over time, presented as percentage of gap size at time point 0 hours. (G) Quantification of time to 50% gap closure. Data in (F) and (G) represent mean from n = 3 independent experiments, each performed in duplicate. *p < 0.05, **p < 0.01, two-tailed unpaired t-test.