
Figure 8. Animal survival studies after CED treatment with cetuximab-IONPs in human GBM U87MGwtEGFR and LN229wtEGFR models.
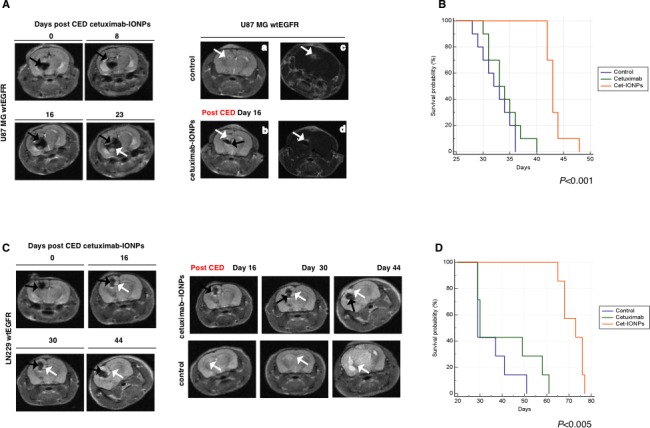
Mice implanted with GBM cell lines (EGFR-expressing U87MGwtEGFR and LN229wtEGFR) to form orthotopic human GBM xenografts underwent CED with cetuximab-IONPs. (A left) T2 weighted MRI revealed the presence of cetuximab-IONPs (black arrows) and their distribution and dispersion on days 0, 8, 16, and 23, white arrow indicates intracranial U87MGwtEGFR xenograft. (A right) Examples of T2 weighted MRI of mice brains showing a GBM xenograft with a bright signal (white arrow) post tumor implantation (day 16) (a); MRI signal drop (black arrow) after cetuximab-IONPs CED (b). Tumor contrast enhancement after administration of gadolinium contrast agent in a control mouse (c) and a mouse treated with cetuximab-IONPs (d). White arrows indicate intracranial xenografts. (B) Kaplan-Meier survival curve of athymic nude mice intracranially implanted with U87MGwtEGFR cells and CED-treated with control, cetuximab, or cetuximab-IONPs. Statistical significance was estimated by log-rank method (P<0.001). (C left) T2 weighted MRI revealed the presence of cetuximab-IONPs (black arrows) and their distribution and dispersion on days 0, 16, 30, and 44 after CED, white arrow indicates intracranial LN229wtEGFR xenograft. (C right) T2 weighted MRI day 16, 30, 44 after CED revealed the presence of cetuximab-IONPs (black arrow) and a small tumor (top panel, white arrow,) in comparison with control mouse (bottom panel, white arrow). (D) Kaplan-Meier survival curve of athymic nude mice intracranially implanted with LN229wtEGFR cells and CED-treated with control, cetuximab and cetuximab-IONPs. Statistical significance was estimated by log-rank method (P<0.005).