
Figure 4. MMP-9 and VEGF-C are downstream targets of WIP1.
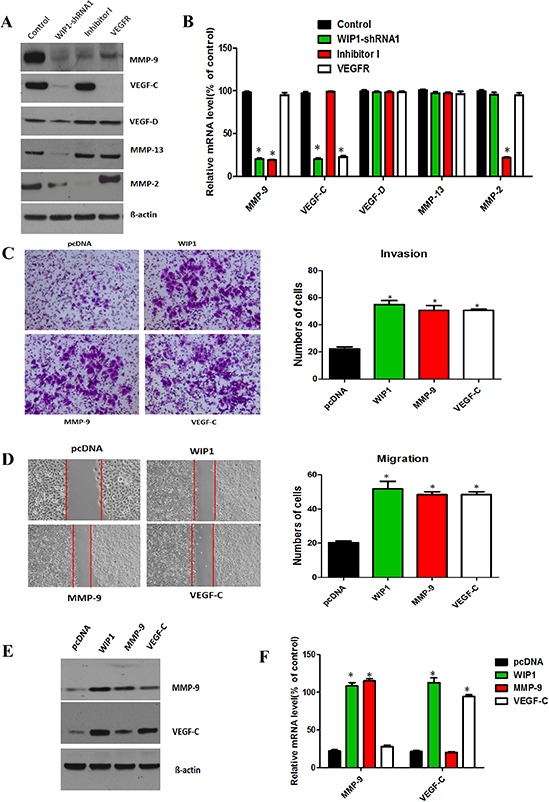
(A), Western blotting analysis of MMP-9, MMP-2, MMP-13, VEGF-C and VEGF-D on WIP1 silencing and inhibitor I and VEGFR-3 in ACC-M cells. ß-actin loading control is also shown. Representative of three independent experiments was shown. (B), The mRNA levels of MMP-9, MMP-2, MMP-13, VEGF-C and VEGF-D were quantified by real-time PCR on WIP1 silencing and MMP inhibitor and VEGFR compared with control cells. GAPDH mRNA levels were used as internal controls. Error bars represent the mean ± SD of triplicate experiments (*p < 0.05). (C and D), Decreased migration and invasion in WIP1 knockdown ACC-M cells were rescued by MMP-9 and VEGF-C overexpression. The quantitative analysis of invasion (C) and migration (D) in WIP1 or MMP-9 or VEGF-C expression vector cells co-transfected with WIP1-shRNA1. The quantitative analysis of migration was measured at 18 h after cell culture. Representative images of migrated and invaded cells were shown under inverted microscopy. The mean was derived from cell counts of 5 fields, and each experiment was repeated 3 times (*p < 0.05). (E), Western blotting analysis of the protein levels of MMP-9 and VEGF-C on ectopic expression of WIP1 or MMP-9 or VEGF-C in WIP1 or MMP-9 or VEGF-C expression vector cells co-transfected with WIP1-shRNA1. (F), RT-PCR analysis of the mRNA levels of MMP-9 and VEGF-C on ectopic expression of WIP1 or MMP-9 or VEGF-C. GAPDH mRNA levels were used as internal controls. Error bars represent the mean ± SD of triplicate experiments (*p < 0.05).