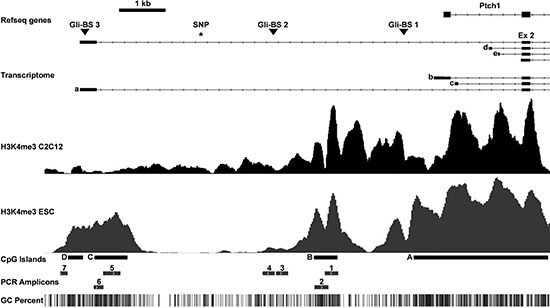
Figure 1. Murine Ptch promoter region analyzed in this study.

The upper part shows the upstream genomic region of Ptch, its transcriptome, the three Gli-binding sites (triangles) and the SNP rs29624336 (asterisk). The alternative exons 1a-1e (a–e) and exon 2 (ex 2) are indicated. H3K4me3 occupancy in differentiated C2C12 cells and murine embryonic stem cells (ESC) as downloaded from the European Nucleotide Archive and NCBI Gene Expression Omnibus are indicated below. The CpG islands (A–D), the analyzed PCR amplicons 1–7 (fragment 3 equates the methylation-sensitive DNA fragment described by Ecke et al. [11], all primers are shown in supplemental Table 1) and the CpG content are shown in the lower part. The largest amplicon 5 (391 bp) could only be amplified in the H3K4me3 ChIP experiment and NGS bisulfite sequencing.
