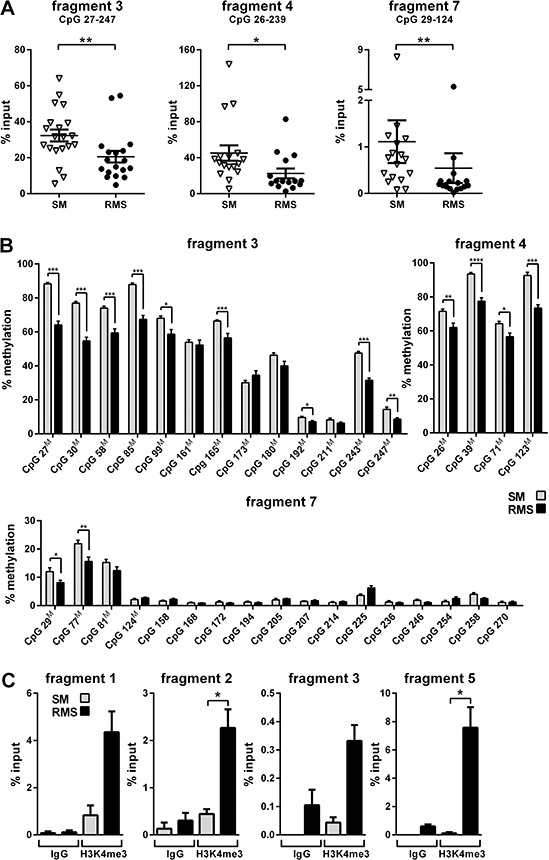
Figure 2. Analysis of methylation and histone occupancy of the Ptch promoter in RMS of heterozygous Ptch mice.

A and B., Decreased methylation of the Ptch promoter in RMS. A, DNA derived from tissue samples from Ptch+/− (n = 10) and Ptchneo67/+ (n = 6) mice was subjected to MeDIP and analyzed by qPCR. Each triangle (SM) and circle (RMS) represents one sample measured in triplicates. Mean values (lines) and SEM are indicated for each group. The decrease in methylation in amplicons 3, 4 and 7 in RMS is statistically significant. The covered CpG dinucleotides (in comparison to bisulfite NGS, see B) are indicated for each fragment. B, Decreased methylation of several CpG dinucleotides in the Ptch promoter in RMS. SM (grey bars) and RMS (black bars) from 9 Ptch+/− mice were analyzed by bisulfite NGS. Mean values and SEM from SM and RMS are given for each CpG at the indicated position within the respective fragment. CpG dinucleotides also covered in the MeDIP assay are marked with a superscriptM. C., H3K4me3 enrichment at the Ptch promoter in RMS. The ChIP enrichment for H3K4me3 was analyzed in chromatin from RMS (black bars) and SM (grey bars) from 1 Ptch+/− and 3 Ptchneo67/+ mice and quantified by qPCR. Mean values and SEM for the amplicons 1, 2, 3 and 5 are shown, IgG served as a negative control. The increase in H3K4me3 occupancy in fragments 2 and 5 in RMS is statistically significant. All statistically significant differences are indicated by asterisks (*P < 0.05, **P < 0.01, ***P < 0.001, ****P < 0.0001).
