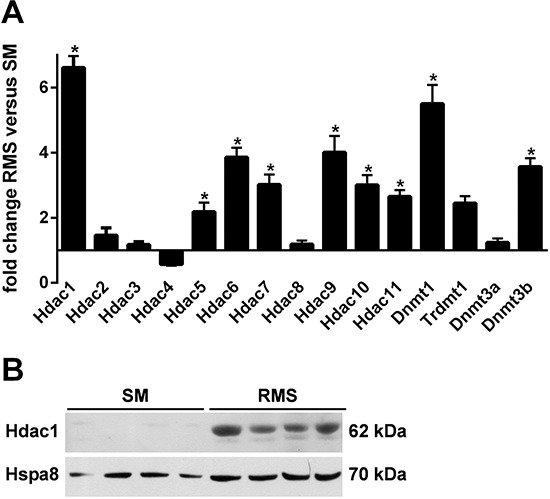
Figure 3. (A) Expression of Hdacs, Dnmts and Trdmt1 in SM and RMS of heterozygous Ptch mice.

Tissue samples were isolated from 4 Ptchneo67/+ mice and analyzed by qPCR. Shown is fold expression of the genes analyzed in RMS (mean ± SEM) in comparison with normal skeletal muscle (SM) that was set to 1. Statistically significant changes in gene expression levels between RMS and SM are marked with an asterisk (P < 0.05). B. increased expression of Hdac1 protein in RMS. Hdac1 was analyzed in protein lysates from RMS and SM derived from 4 Ptchneo67/+ mice. Hspa8 served as loading control.
