
Figure 1. Relative HNF1A-AS1 expression in lung adenocarcinoma tissues and its clinical significance.
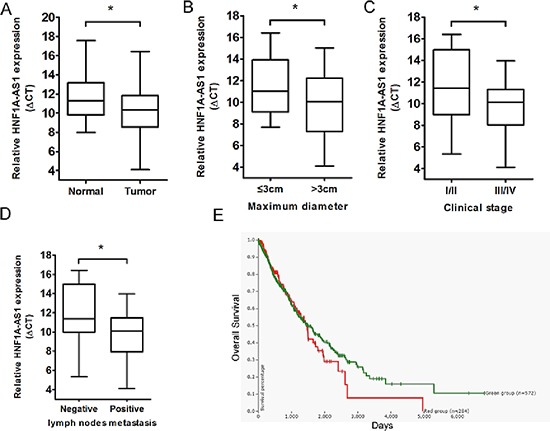
(A) Relative expression of HNF1A-AS1 expression in lung adenocarcinoma tissues (n = 40) and in paired adjacent normal tissues (n = 40). HNF1A-AS1 expression was examined by qPCR and normalized to GAPDH expression. (shown as ΔCT) (B–D) HNF1A-AS1 expression was significantly higher in patients with big tumor size, advanced clinical stage and lymph nodes metastasis. (E) The Kaplan-Meier plot in UCSC Cancer Genomics Browser indicated that HNF1A-AS1 high expression (red line) has a worse overall survival compared to the low expression subgroup (green line). See https://genome-cancer.ucsc.edu/proj/site/hgHeatmap/#? bookmark=3c7d51368bb7caa36d17e4c957103893. *p < 0.05.