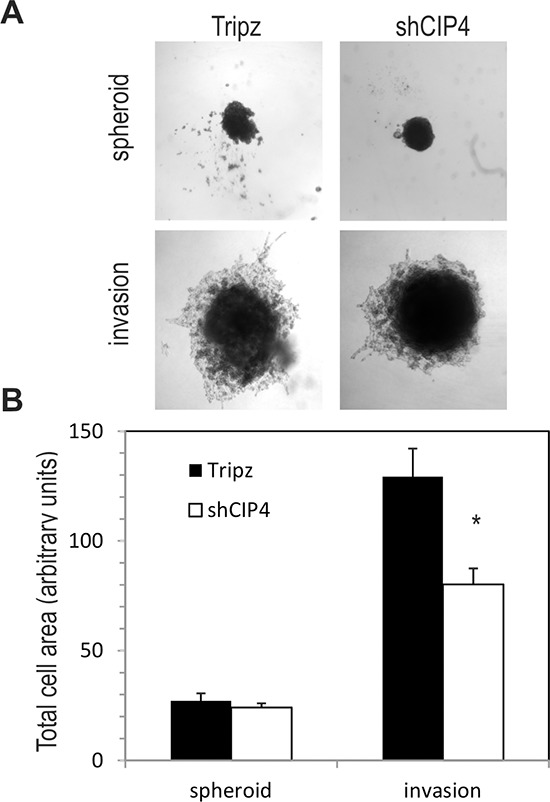
Figure 3. CIP4 promotes TNBC cell invasion.

(A) Representative phase contrast images of spheroid colonies for MDA-MB-231 Tripz or shCIP4 (day 3) and following addition of invasion matrix (day 10, invasion). (B) Graph represents total cell area for spheroids colonies and post-invasion colonies (mean ± SD, *p < 0.05; representative results for 1 of 3 experiments).
