
Figure 1. Epifluorescence microscopy-based assessment of cellular viability in response to standard inducers of apoptosis.
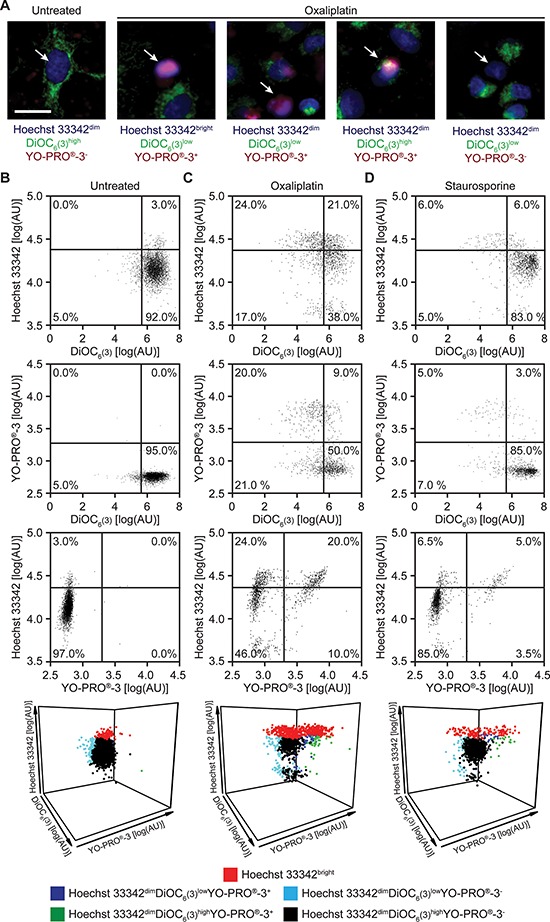
(A–D) Human non-small cell lung carcinoma A549 cells were maintained in control conditions or exposed to 500 μM oxaliplatin or 4 μM staurosporine for 24 hrs, then imaged by epifluorescence microscopy upon co-staining with Hoechst 33342, DiOC6(3) and YO-PRO®-3. Representative images and dot plots obtained upon automated image segmentation and analysis are reported. Scale bar = 10 μm. In panels B, C and D, numbers indicate the percentage of events within each gate. See also Supplementary Figure 1.