
Figure 3. Flow cytometry-based assessment of cell death modulation.
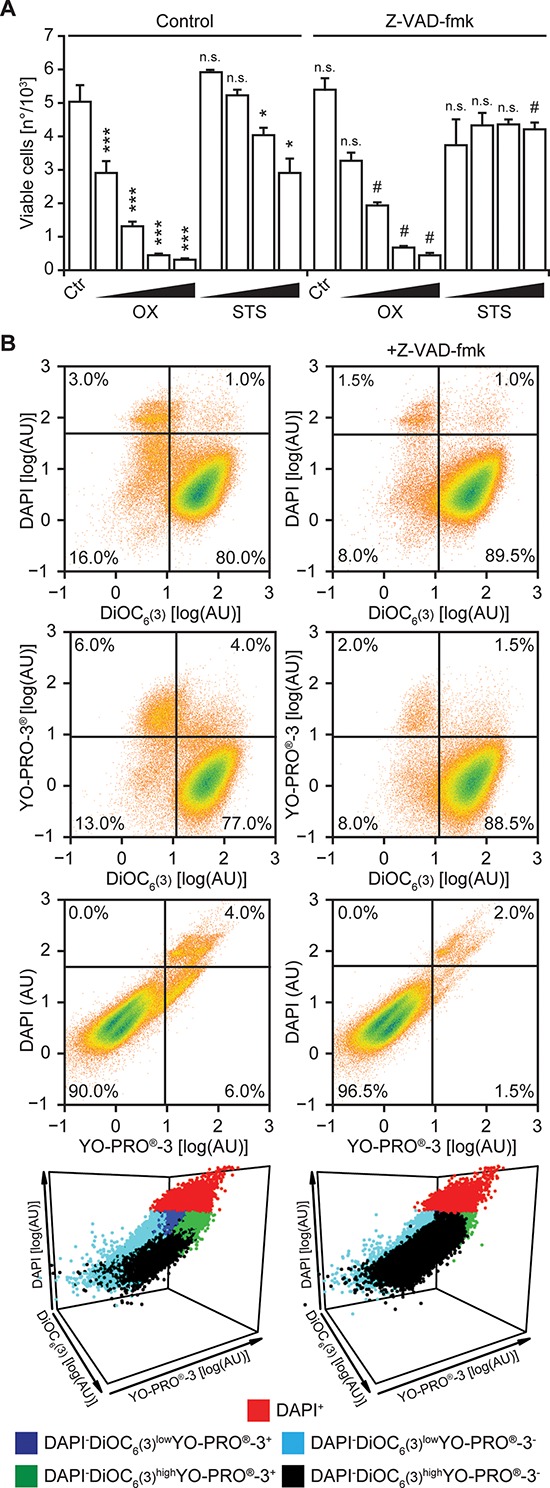
(A–B) Human non-small cell lung carcinoma A549 cells were maintained in control conditions (Ctr) or incubated with increasing concentrations of staurosporine (STS; 0.5–1.0–2.0–4.0 μM), oxaliplatin (OX; 0.125–0.250–0.500–1 mM) and 50 μM Z-VAD-fmk, alone or in combination for 24 hrs. Thereafter, cells co-stained with DAPI, DiOC6(3) and YO-PRO®-3 and analyzed by flow cytometry. In panel (A) quantitative data on the absolute number of DAPI−DiOC6(3)highYO-PRO®-3− (viable) cells are reported (means ± SD, n = 3 replicate assessments from one representative experiment; *p < 0.05, ***p < 0.001, as compared to untreated cells; #p < 0.05, as compared to cells maintained in the same conditions in the absence of Z-VAD-fmk; n.s., non-significant, as compared to untreated cells or cells maintained in the same conditions in the absence of Z-VAD-fmk). In panel (B) dot plots depict the aggregate analysis of cells maintained in control conditions and exposed to 4 μM STS or 500 μM OX, alone (left panels, upon pooling data from 3 distinct samples) or in the presence of Z-VAD.fmk (right panels, upon pooling data from 3 distinct samples). Numbers indicate the percentage of events within each gate.