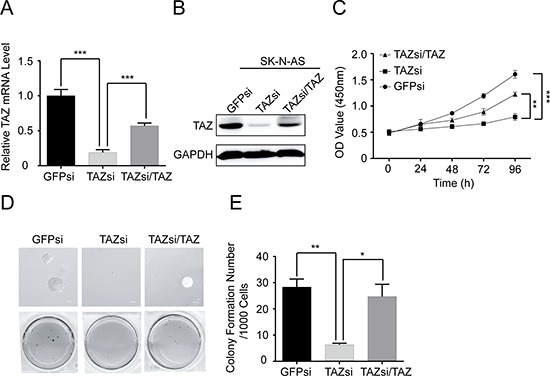
Figure 4. Knockdown of TAZ inhibits cell proliferation and colony formation.

SK-N-AS cells were transfected with control siRNA, TAZ siRNA or TAZ siRNA/TAZ. (A) Total RNA was isolated and TAZ mRNA was quantified using qRT-PCR analysis. Data represent the means ± SD from three independent experiments (**P < 0.001). (B) Total celluler extracts were prepared and subjected to Western blot using antibody against TAZ. (C) SK-N-AS cells were seed into a 96-well plate (1000 cells/well), and cell proliferation was determined using cell counting kit-8 assay kit. Data represent the means ± SD from three independent experiments (**P < 0.01; ***P < 0.001). (D) Colony formation was examined by soft agar assay. (E) Colony number was counted using counter. The values represent the mean ± SD from three independent experiments (*P < 0.05 or **P < 0.01).
