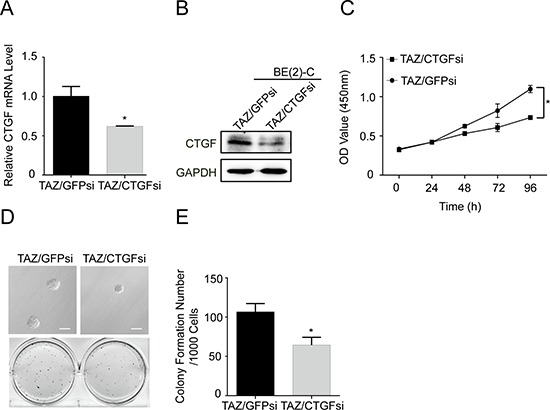
Figure 7. CTGF is a major downstream transcriptional target of TAZ.

TAZ overexpressing BE(2)-C cells were infected with CTGF siRNA. (A) qRT-PCR analysis was performed to determine the expression of CTGF at mRNA levels. Data represent the means ± SD from three independent experiments, *P < 0.05. (B) Western blot analysis was performed to determine the expression of CTGF. GAPDH levels are shown as loading control. (C) Cells were seed into a 96-well plate (1000 cells/well), after which cell proliferation was determined using cell counting kit-8 assay kit. Data represent the means ± SD from three independent experiments (*P < 0.05). (D) Colony formation was examined by soft agar assay. (E) Colony number was counted using counter. The values represent the mean ± SD from three independent experiments (*P < 0.05).
