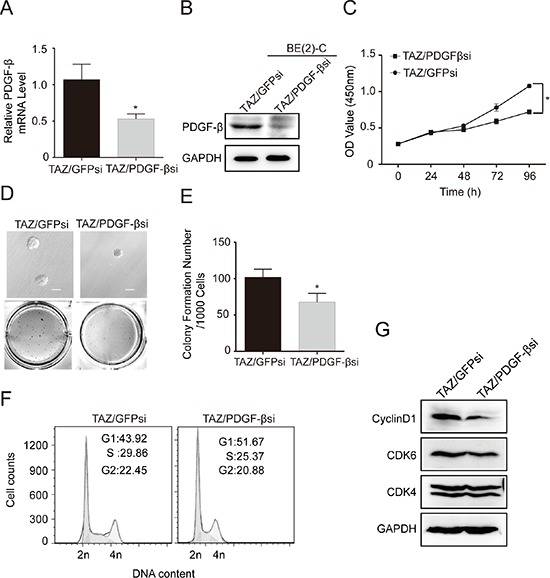
Figure 8. PDGF-β is a major downstream transcriptional target of TAZ.

TAZ overexpressing BE(2)-C cells were infected with PDGF-β siRNA. (A) qRT-PCR analysis was performed to determine mRNA expression of PDGF-β. Data represent the means ± SD from three independent experiments. (*P < 0.05). (B) Western blot analysis was performed to determine PDGF-β expression. GAPDH levels are shown as loading control. (C) Cells were seed into a 96-well plate (1000 cells/well), and cell proliferation was determined using cell counting kit-8 assay kit. Data represent the means ± SD from three independent experiments. (*P < 0.05). (D) Colony formation was examined by soft agar assay. (E) Colony number was counted using counter. The values represent the mean ± SD from three independent experiments (*P < 0.05). (F) Cell cycle was analyzed using PI staining and flow cytometry. (G) Immunoblot analysis was performed to determine the expression of G1 cell cycle regulatory proteins including cyclin D1, CDK4 and CDK6. GAPDH levels are shown as loading control.
