
Figure 3. Kaplan–Meier estimates of DFS and OS by tumor phenotype conversion.
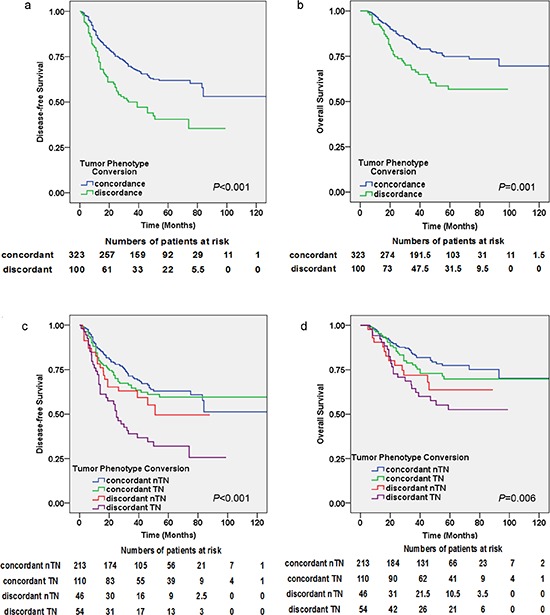
(a) DFS (log-rank test: P < 0.001), (b) OS (log-rank test: P = 0.001). Kaplan–Meier estimates of DFS and OS for the groups with concordant triple-negative (TN) group, concordant non-TN (nTN) group, discordant TN group and discordant nTN group: (c) DFS (log-rank test: P < 0.001), (d) OS (log-rank test: P = 0.003).