
Figure 2. Molecular classification in HNSCC.
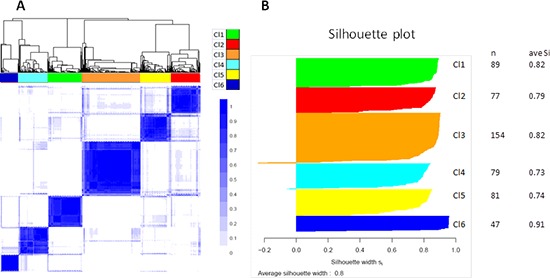
Results are produced by ConsensusClusterPlus for 527 cases on 4950 most variable genes. A. Consensus matrix heatmap imposing six subtypes on the dataset: Cl1 (n = 89; 17%); Cl2 (n = 77; 15%); Cl3 (n = 154; 29%); Cl4 (n = 79; 15%); Cl5 (n = 81; 15%); Cl6 (n = 47; 9%). The consensus values range from 0 (white, samples that never cluster together) to 1 (blue, samples showing high clustering affinity). B. Silhouette plot analysis. Since the actual number of subtypes in HNSCC is not known, we should take into account that the number of subtypes may be greater than six with some subtypes not sufficiently represented in our dataset. To ascertain whether some samples are forced to belong to a certain cluster, silhouette plot analysis was carried out. The widths indicate a strong similarity of the samples within their subgroup compared with the samples belonging to other subgroups.