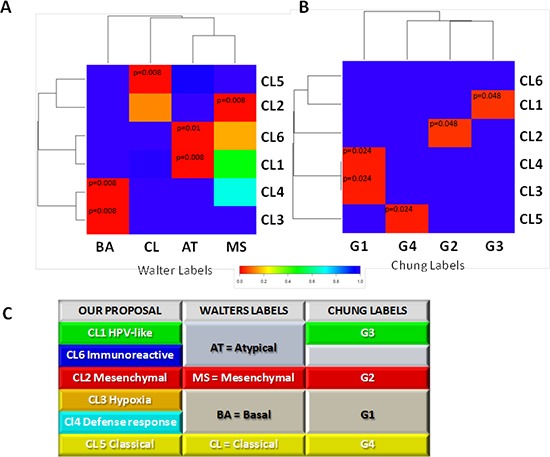
Figure 4. Comparison of genome-wide molecular pattern between our and previously reported subtype classification.

The analysis was performed using Subclass Mapping. A. MetaHNC-A is compared with the molecular subtypes defined by Walter et al. ((48); GSE39368). B. MetaHNC-A is compared to the subtypes reported by Chung et al. ((47); GSE686). Red color indicates high confidence for correspondence (p < 0.05); blue color indicates lack of correspondence. BA, basal; MS, mesenchymal; AT, atypical; CL, classical subtypes in the study by Walter et al. G1, G2, G3, G4 refer to the four subtypes identified in the study by Chung et al. C. Table summarizing the correspondence between our subtyping classification and those previously published for HNSCC by Chung et al. (47) and Walter et al. (48).
