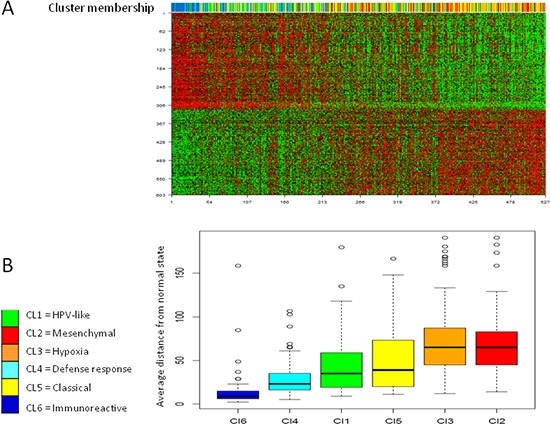
Figure 5. Progression analysis of disease.

The average distance of each tumor from the normal state has been assessed. A. 603 genes were identified associated to PAD. The upper bar illustrates to which subtype belongs each tumor sample. B. The box plots show the distance from normal state of each tumor was in relation to the six subtypes. Y-axis represents the distance from normal state computed as average bin-membership by PAD and depicted in Figure S4.
