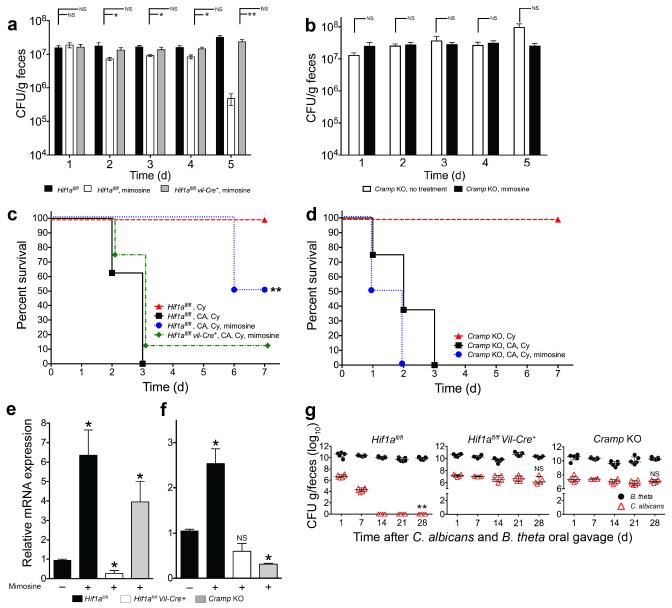
Figure 4. L-mimosine activation of HIf1a and Cramp in vivo decreases Candida albicans GI colonization and dissemination.
Candida albicans GI colonization levels in (a) Hif1afl/fl, Hif1afl/fl Vil-Cre+, and (b) Cramp KO mice treated with antibiotics, colonized with CA and then treated ± L-mimosine. n=8. Bars represent the mean ± SEM. Statistical analysis performed by Mann-Whitney test. * p<0.05; ** p<0.001; ns, not significant. Survival curves of (c) Hif1afl/fl, Hif1afl/fl Vil-Cre+, and (d) Cramp KO mice treated with antibiotic water, colonized with CA, treated ± L-mimosine for five days and then given cyclophosphamide. L-mimosine treatment continued for an additional 7 days after the first cyclophosphamide dose. n=8. Statistical analysis performed by log-rank test. * p< 0.05; ** p<0.01; ns, not significant. (e) Hif1a and Cramp mRNA levels in colons of Hif1afl/fl, Hif1afl/fl Vil-Cre+, and Cramp KO mice treated ± L-mimosine. n=4. All data shown are means ± SEM. Assays were performed in triplicate. Statistical analysis performed by Mann-Whitney test. * p< 0.05; ** p<0.01; ns, not significant. (g) C. albicans (red triangles) and B. theta (black circles) GI colonization levels in antibiotic-treated Hif1afl/fl, Hif1afl/fl Vil-Cre+, and Cramp KO mice. n= 6 for Hif1afl/fl and Cramp KO mice. n=5 for Hif1afl/fl Vil-Cre+. Black circles (B. theta) and red triangles (CA) represent results from individual animals. Horizontal lines represent the median with interquartertile range. * p<0.05, ** p<0.01. Statistical analysis by Mann-Whitney test.

