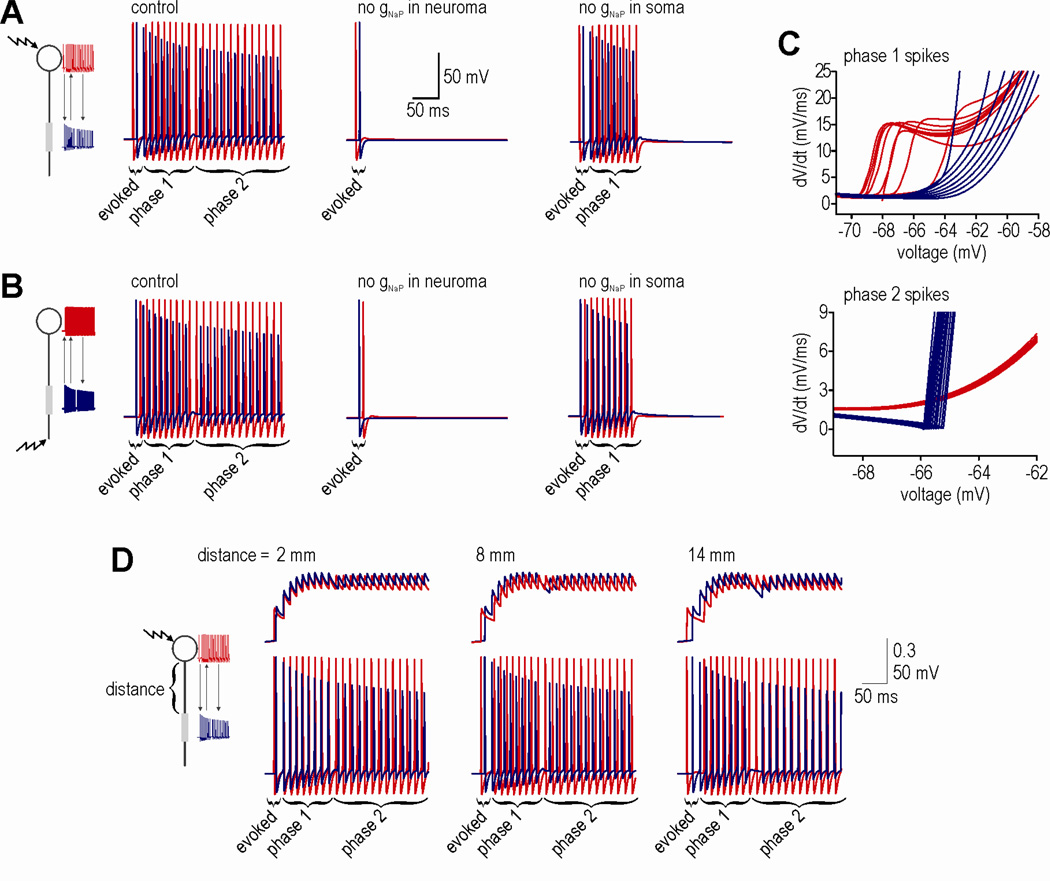
Figure 1.
Multi-phase AD in an HH model. Cartoons depict model with the site of stimulation indicated by a jagged arrow. Direction of spike propagation (indicated by arrow) is inferred from the relative timing of spikes recorded in the soma (red) and neuroma (blue). (A) Somatic stimulation initiated a first phase of AD whose spikes originate in the neuroma and a second phase of AD whose spikes originate in the soma. Removing gNaP from the neuroma (1.9 mS/cm2) prevented both phases of AD whereas removing gNaP from the soma (0.19 mS/cm2) blocked only phase 2 AD. (B) Stimulating the distal end of the axon triggered the same spiking patterns as in A. (C) Phase planes demonstrate the kinkiness of the voltage trajectory near spike threshold: locally initiated spikes exhibit a smoothly accelerating voltage trajectory whereas propagated spikes exhibit a more abruptly accelerating voltage trajectory. This analysis confirms that phase 1 AD spikes originate in the neuroma whereas phase 2 AD spikes originate in the soma. (D) Similar phase 1 and 2 AD patterns were elicited independently of the distance between sites. Top traces show relative activation of gNaP.

