
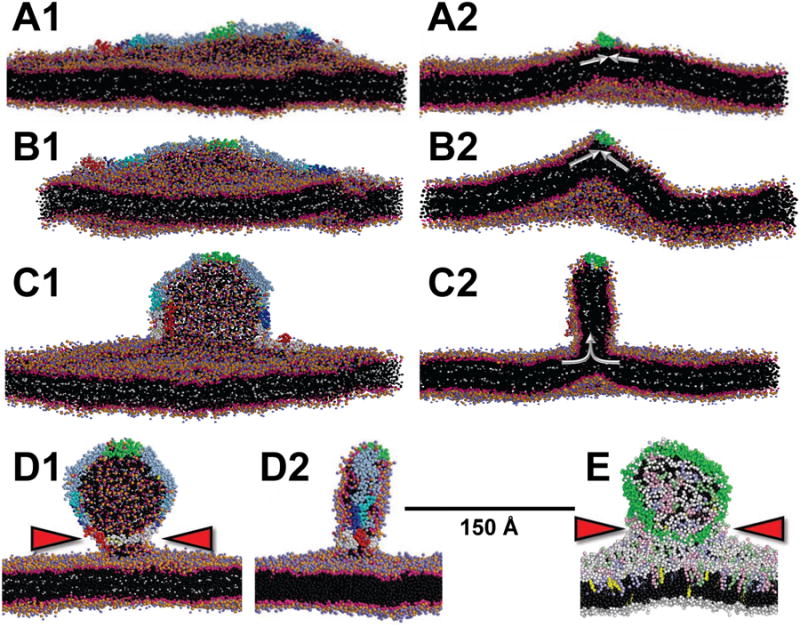
Figure 4. CGMD showing stabilization by apoA-I of OM pleats created from a planar periodic bilayer by an increased TBDG δ.
(A) 100 ns simulation of the initial bilayer (without deletions) showing bending created by the wedge-effect of OM insertion of the amphipathic helical domains of apoA-I. (B) At 100 ns with d = 1.18 showing increased bilayer bending. (C) At400 ns with δ = 1.18 showing sudden transformation of increased bilayer bending into bilayer pleating and formation of a hemi-disc whose edges are lined by the apoA-I belt. (D) θ-apoA-I model (see Figure S4C) attached to the OM of a bilayer at 8 μs with δ = 1.18. Red arrowheads indicate the lipid stalk. Left hand panels are viewed orthogonal to the long axis and right hand panels are cross-sectional views down the long axis of apoA-I; white arrows indicate the OM surface density vector. POPC and solvent as in Figure 2. Tandem helical repeats of apoA-I are: repeat 1 (residues 44-65), blue; repeat 5 (121-142), green; repeat 8 (187-208), cyan; C-terminal repeat 10 (220-241), red. The N-terminal domain (1-43) is white and the remainder of apoA-I is gray. (E) θ apoA-I model attached to the OM of a mixed lipid bilayer at 12.8 μs with δ = 1.33. Polar moieties of POPC are shown as white spheres and hydrocarbon tails as black spheres; POPE, pale blue spheres; POPS, pink spheres; SM, pale green spheres; UC, yellow spheres; protein, green spheres. Red arrowheads indicate the lipid stalk. See also Figure S4 and Movie S1.