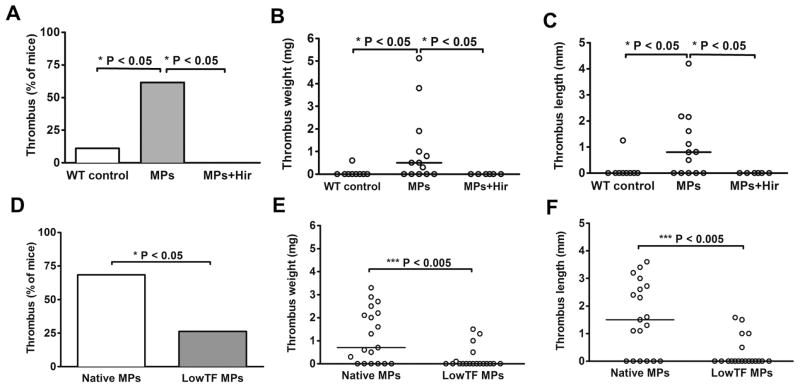
Fig. 3.
(A–C) One-hour IVC stenosis in control WT mice (WT control, n=9), mice infused intravenously with cancer cell-derived MPs (MPs, n=13) and in mice infused with cancer cell-derived MPs and pretreated with hirudin (MPs + Hir, hirudin 8U/g, n=6). (A) Percentage of mice with a thrombus. (B and C) Values for weight and length of each thrombus. Horizontal bars in dot plots represent median. (D–F) One-hour IVC stenosis in WT mice infused with unmodified Panc02-derived MPs (Native MPs, n=19) and in mice infused with LowTF MPs (LowTF MPs, n=19), (D) Percentage of mice with a thrombus. (E and F) Values for weight and length of each thrombus. Horizontal bars in dot plots represent median.

