Figure 4.
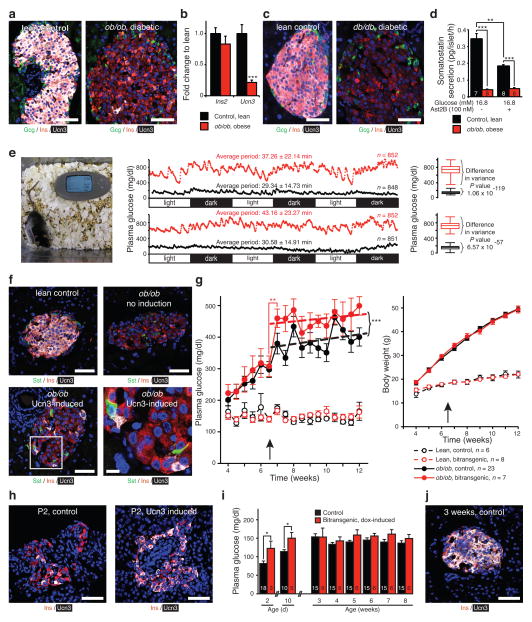
Ucn3 marks mature beta cells and aggravates hyperglycemia. Ucn3 immunoreactivity (a) and gene expression (b) (n = 9 controls, n = 8 ob/ob) in islets from ob/ob and db/db mice (c). (d) Somatostatin release from ob/ob islets compared to lean controls in response to Ast2B. (e) Loss of Ucn3 correlates with increased glycemic volatility and extended period length in ob/ob animals compared to lean controls, n reflects the number of data points, P values reflect differences in variance between animals, see Supplementary Table 2. (f) Doxycycline–inducible Ucn3 overexpressing mice (Supplementary Fig. 5) crossed on the ob/ob background facilitate the restoration of Ucn3 expression by beta cells. (g) Effect of Ucn3 induction on plasma glucose and body weight in doxycycline-inducible Ucn3 overexpressing mice. (h, i, j) Effect of Ucn3 induction on plasma glucose before and after endogenous Ucn3 is expressed in all beta cells. Scale bars, 50 μm in all panels except the detail in f, lower right (10 μm). Significance determined by Student’s t–test (b, i) or by one–way ANOVA followed by Student’s t–test with Welch’s correction as necessary (d) or by linear regression between groups before and after induction (g), and Student’s t–test to compare the glucose values immediately before and after induction. Significance of Ucn3 induction in (i) determined by Student’s t–test for P2 and P10 groups and by two–way ANOVA for treatment and time for older ages. Values are mean ± s.d. in (e) and mean ± s.e.m. in all other panels, *P < 0.05, **P < 0.01, ***P < 0.001.

