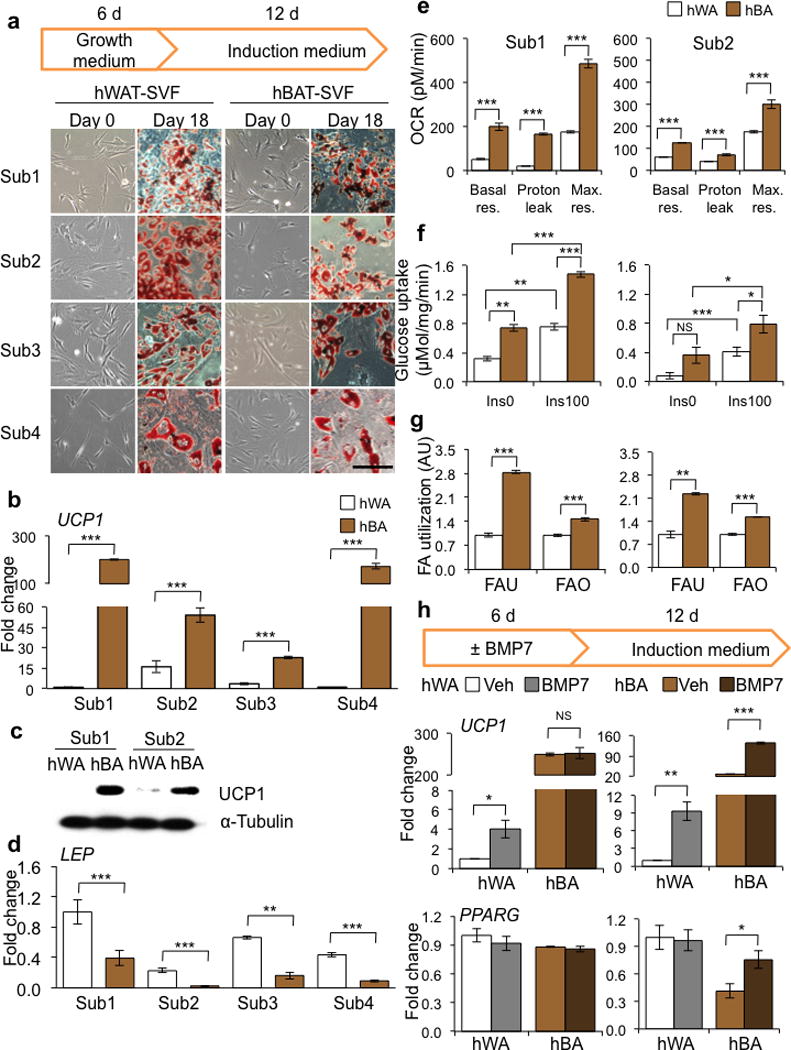
Figure 1.

Generation and characterization of immortalized human brown and white fat progenitors. (a) Light microscopic images of immortalized human WAT progenitors (hWAT-SVF) and human BAT progenitors (hBAT-SVF) at day 0 and 18 (stained with Oil Red O) from 4 subjects. Scale bar, 100 μm. (b,d) Q-RT-PCR analysis for UCP1 and LEP mRNA expression in differentiated adipocytes from hWAT-SVF and hBAT-SVF of 4 subjects. Data are presented as fold changes relative to Sub1 hWA (mean ± s.e.m., n=3). (c) Western blot analysis of UCP1 protein level in hWA and hBA differentiated from progenitors of Sub1 and Sub2. α-Tubulin serves as a loading control. (e) Oxygen consumption rate (OCR) was measured in the absence (Basal respiration, Basal Res.) and presence of oligomycin (Proton Leak) or FCCP (Maximal respiration, Max. Res.) in hWA and hBA from Sub1 (Left) and Sub2 (Right). Data are presented as mean ± s.e.m. (n=10; hWA vs hBA). (f) Glucose uptake was measured using 3H-2-deoxy-glucose in hWA and hBA stimulated with (Ins100) or without (Ins0) 100 nM insulin from Sub1 (Left) and Sub2 (Right). Data are presented as mean ± s.e.m. (n=3). (g) Fatty acid uptake (FAU) and fatty acid oxidation (FAO) were measured using 14C-palmitic acid in hWA and hBA from Sub1 (Left) and Sub2 (Right). Data are presented as a fold change compared to hWA (mean ± s.e.m., n=3). (h) Q-RT-PCR analysis for UCP1 and PPARG mRNA expression in hWA and hBA from Sub1 (Left) and Sub2 (Right). Data are presented as fold changes compared to vehicle-hWA for each subject (mean ± s.e.m., n=3; NS, not significant; Veh vs BMP7). Two-tailed Student’s t-test was used to determine P values (* P < 0.05, ** P < 0.01, *** P < 0.001).
