
Figure 2. Down-regulated Turnover of AXL in Gefitinib Resistant H292 (H292-Gef) Cell Line.
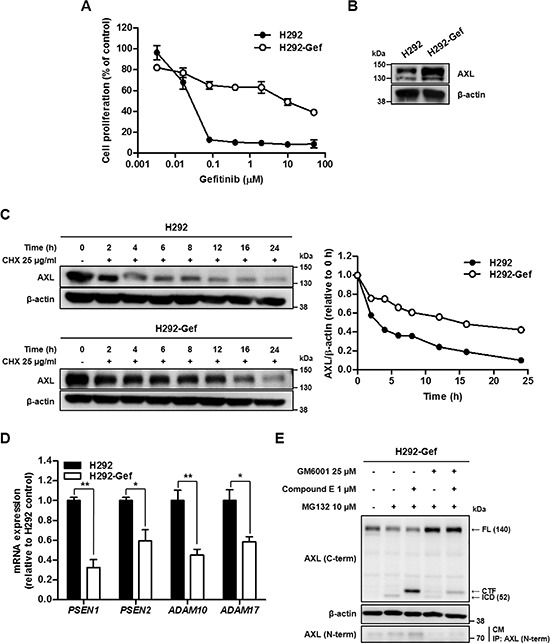
(A) H292 and H292-Gef cells were treated with gefitinib for 72 h, and the proliferation of the cells was measured using the SRB assay. The IC50 values were calculated using the TableCurve 2D software, and the data are presented as the means ± SD. (B) The basal protein expression of AXL was determined by western blot using β-actin as the loading control. (C) The cells were treated with 25 μg/ml CHX for the indicated times. The lysates were analyzed by western blot analysis with antibody against C-terminal AXL using β-actin as a loading control. The expression levels were quantified by densitometry using ImageJ. (D) The mRNA expression of the indicated markers in cells was determined by real-time PCR, and the β-actin mRNA levels were used for normalization. The data are presented as the mean fold changes ± SD relative to the H292 control. (E) H292-Gef cells were treated with GM6001 and/or compound E overnight and then with MG132 for 3 h before being collected for western blot analysis using β-actin as a loading control. For determination of NTF, the culture medium (CM) was collected, immunoprecipitated with antibody against N-terminal AXL, and immunoblotted using anti-N-terminal AXL. The results are representative of two (C, E) or three (A, B, D) independent experiments. *P < 0.05, **P < 0.01, ***P < 0.005 by t-test.