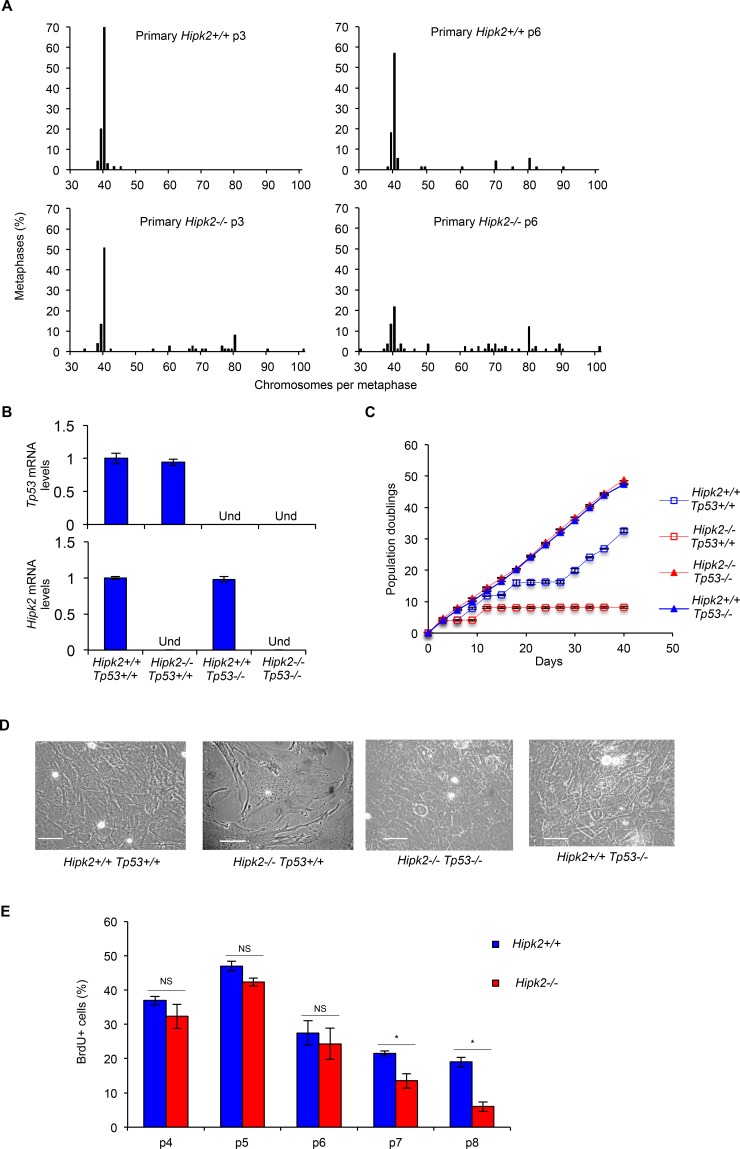
Figure 4. CIN and proliferation in primary MEFs.
A, MEFs derived from three Hipk2+/+ and −/− embryos from two independent litters were analyzed; the percentage of metaphases with the indicated chromosome number is shown. B, p53 and Hipk2 mRNA levels of indicated MEFs were analyzed by quantitative real time RT-PCR at p2 after explantation as control. Relative fold-enrichments were determined by the 2−ΔΔCt method, using Actin as normalizer, and data are represented as mean ± SD. C, Doublings of indicated MEFs were scored and a representative curve of three different experiments performed in triplicate is shown, right. Data are presented as mean ± SD. D, Representative bright-fields of indicated MEFs at p7 after explantation are shown, scale bar, 50 μm. E, MEFs proliferative activity was evaluated as the percentage of BrdU incorporation. BrdU positivity was measured at the indicated p and data presented as mean ± SD (* P= 0.037 at p7 and P= 0.012 at p8, Student t test).

