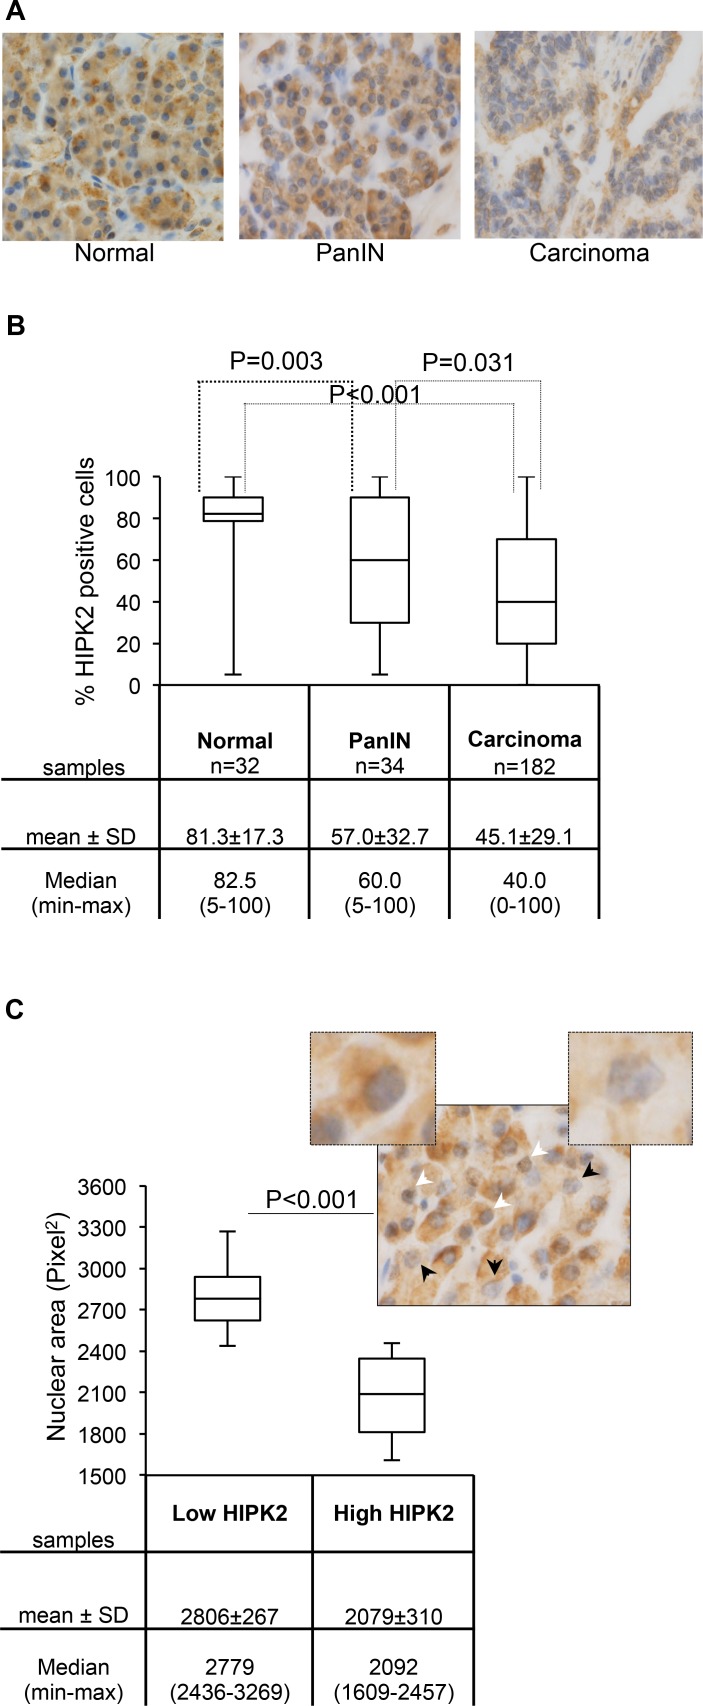
Figure 5. HIPK2 expression during pancreatic malignant progression.
A, Representative images of HIPK2 immunostaining in normal pancreas, PanIN-3, and adenocarcinoma samples. B, The percentage of HIPK2 positive cells observed in each indicated subset of samples is reported and P values for the Wilcoxon test are shown. C, Nuclear area size distribution of low and high HIPK2-expressing cells in PanIN-3 samples (n=12) was evaluated and reported; for each case 400 tumor nuclei were measured and P value for the Student t test is shown. Low and high HIPK2-expressing cells show 2.3 fold of difference in the intensity of the staining. A representative PanIN-3 image in which the black arrows indicate low HIPK2 expressing cells and the white arrows indicate high HIPK2 expressing cells is reported and 5X magnification of indicated cells is shown.

