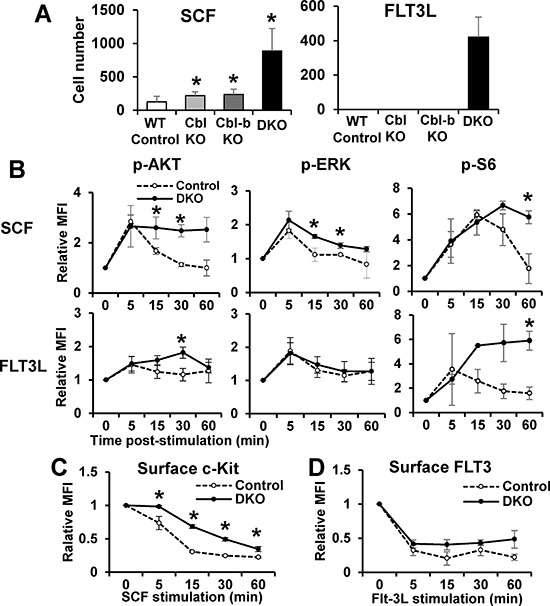
Figure 3. Loss of Cbl and Cbl-b enhances c-Kit and FLT3 signaling in HSCs.

(A) Proliferation - LSK cells (50/well of 96-well plate; 6 replicates in each experiment) were cultured with SCF or FLT3L (10 ng/ml) for 7 days and counted. Representative experiment of 2. (B) p-Akt, p-Erk and p-S6 in LSK cells after time-course ligand stimulation were analyzed by FACS. Data expressed as mean fluorescence intensity (MFI) plots (mean ± SD of at least two independent experiments). (C–D) Cell surface c-Kit (C) and FLT3 (D) levels in LSKs were quantified by FACS at various time points after SCF or FLT3L stimulation. Data from at least 2 independent experiments (*p < 0.05).
