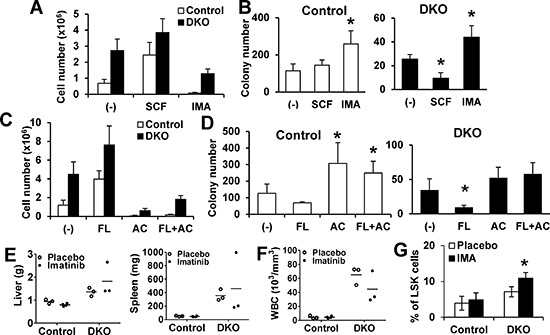
Figure 4. Impact of modulating c-Kit or FLT3 signaling on DKO HSC exhaustion.

(A–B) LTC-IC assays. Initial co-cultures performed without growth factors (control), or with SCF (100 ng/ml) or Imatinib (1 uM), and cell numbers counted (A), followed by colony forming assay (B) Data are from four independent experiments. (C–D) Assay was performed as in A and B, with primary co-culture without (Control), or with FLT3L (FL, 100 ng/ml), AC220 (AC, 100 nM) or FLT3L (100 ng/ml) + AC220 (100 nM). Cell numbers after initial culture (C) and colony-formation assay (D) are shown. Data are from four independent experiments. (E–G) Imatinib in vivo treatment. (E) Liver and spleen weights of mice with indicated treatment. (F) WBC counts. Dots represent individual mice. (G) BM analysis.% LSK cells in Lin- cells is shown. Data from at least three mice are pooled and shown as mean ± SD. *p < 0.05.
