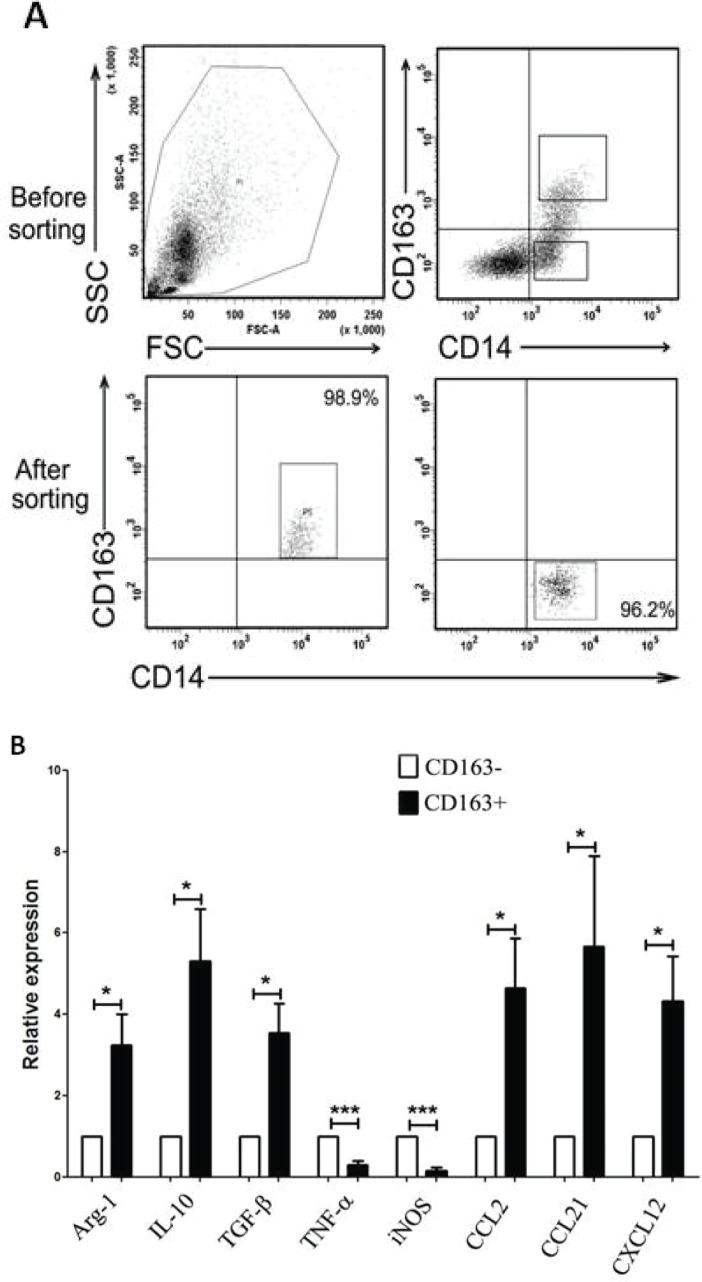
Figure 2. Expression of M1- and M2- related cytokines in CD163+ and CD163− macrophages.
A, CD163+ and CD163− macrophages were sorted by FACS, respectively. One representative analysis is shown. B, Relative expression level of M1-related cytokines (TNF-α and iNOS) and M2-related cytokines (Aginase-1, IL-10, TGF-β, CCL2, CCL21, CXCL12) in CD163+ and CD163− macrophages was analyzed by real-time PCR. Results are presented as histogram. * = P<0.05, *** = P<0.001.

