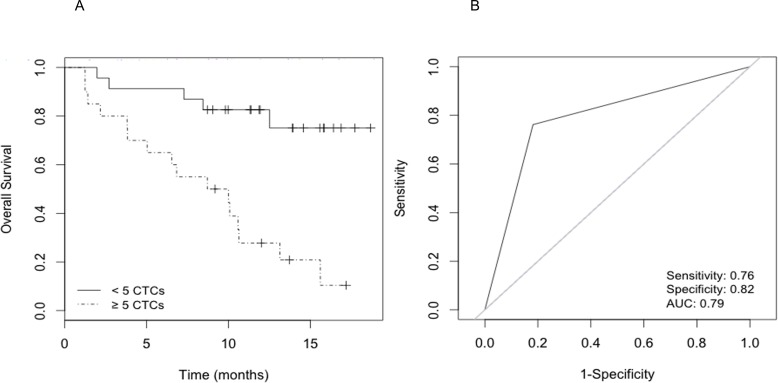
Figure 1. Survival analysis according to CTC count.
A) Kaplan-Meier curves that estimate the probabilities of overall survival (OS) of CRPC patients with <5 and ≥5 CTCs. The log-rank test was used to assess the statistical difference between the two groups (P<0.001); B) Receiver operating characteristic (ROC) curve for prediction accuracy of ≥5 CTCs content in OS of CRPC.

