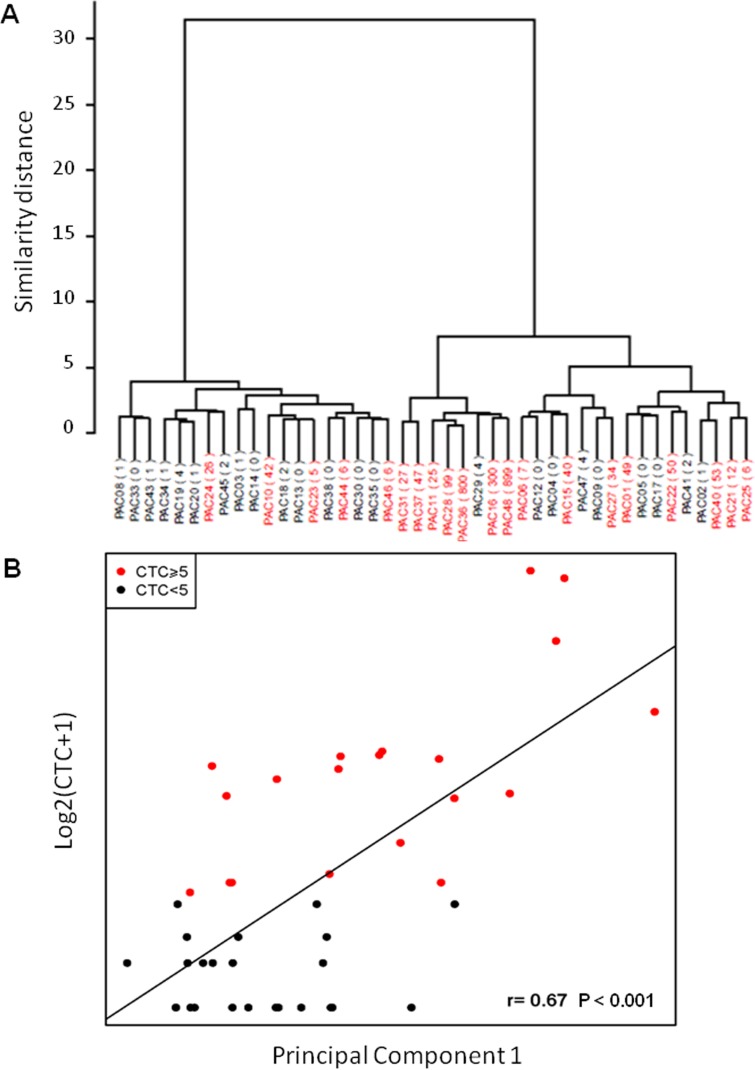
Figure 2. Correlation between gene expression data in PBMNC and CTC count.
A) Unsupervised clustering grouping patients according to gene expression data; B) Principal component analysis. The Y-axis represents the log2 of the CTC number plus one, and the X-axis is PC1 (Spearman correlation P<0.001).

