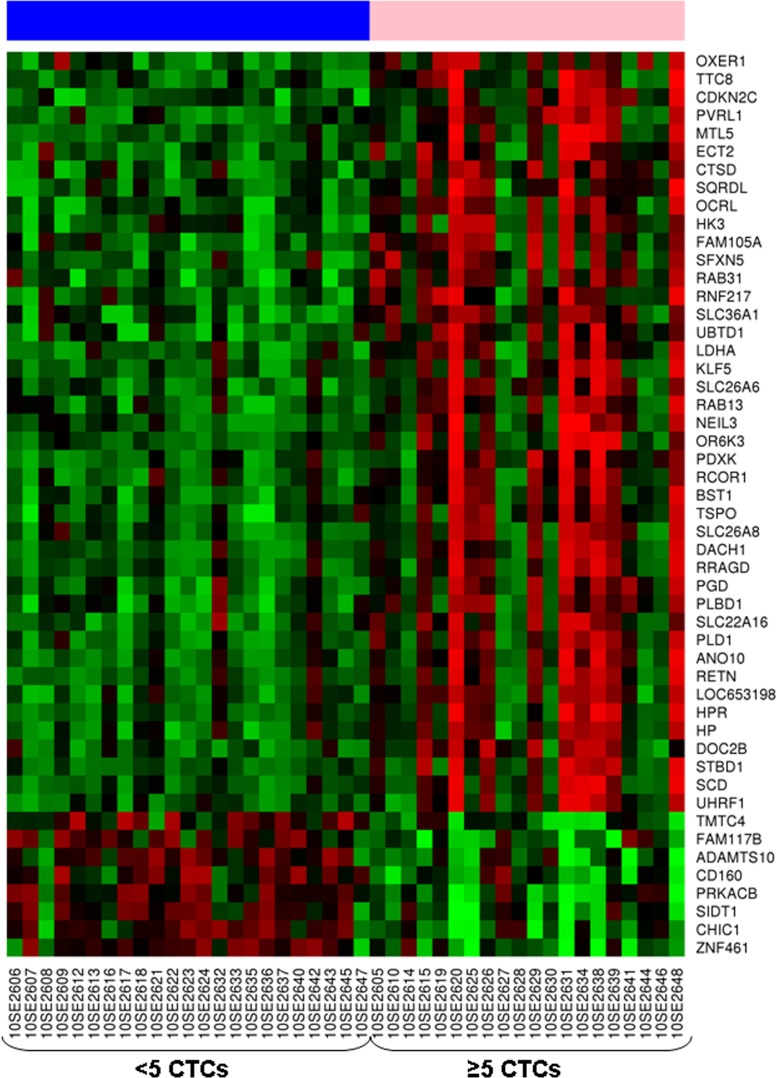
Figure 3. Heatmap representing expression profile of the 50 most differentially expressed genes in samples from castration-resistant prostate cancer patients with ≥5 CTCs compared to those with <5 CTCs (FDR<0.001).
Rows represent genes and columns represent hybridized samples. Red pixels: upregulated genes; Green pixels: downregulated genes. The intensity of each color denotes the standardized ratio between each value and the average expression of each gene across all samples.

