
Figure 2. Relative TERT expression in glioma samples according to mutation status of the TERT promoter.
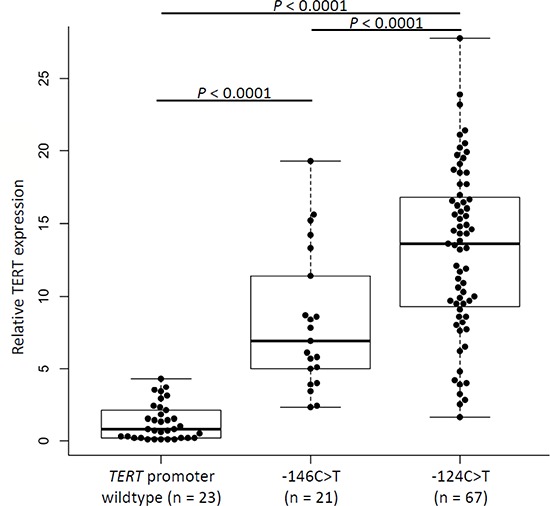
Comparison of TERT mRNA expression in gliomas without and with TERT promoter mutations –124C > T or –146C > T. Expression of TERT gene was normalized to GUSB expression, used as an internal standard, and quantification was performed by ΔΔCT method with log2 transformation. Experiments were carried out in triplicates and box plots represent mean ± standard error of means; P (wildtype/–146C > T) < 0.0001; P (Wildtype/–124C > T) < 0.0001; P (–146C > T/–124C > T) < 0.0001. P-values were determined by t-test.