
Figure 5. EGCG upregulates sirt1 expression and activation.
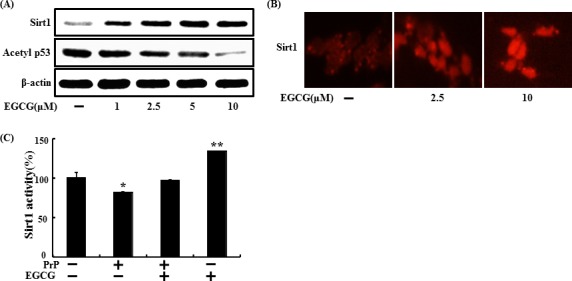
SH-SY5Y cells were treated with 2.5, 5, or 10 μM of EGCG for 30 hr. Western blot for sirt1 and acetyl-p53 proteins was analyzed from SH-SY5Y cells. Beta-actin was used as the loading control A. SH-SY5Y cells were analyzed by immunocytochemistry for sirt1 B. The cells were immunostained with sirt1 antibody (red) and observed in fluorescent view. SH-SY5Y cells were pretreated with 10 μM EGCG for 1 hr and then exposed to 50 μM PrP (106-126) for 36 hr. Sirt1 deacetylase activities in were analyzed in the nuclei of SH-SY5Y cells C. Bars indicate mean ± standard error (n = 4). *p < 0.05, **p < 0.01 significant differences between control and each treatment group.