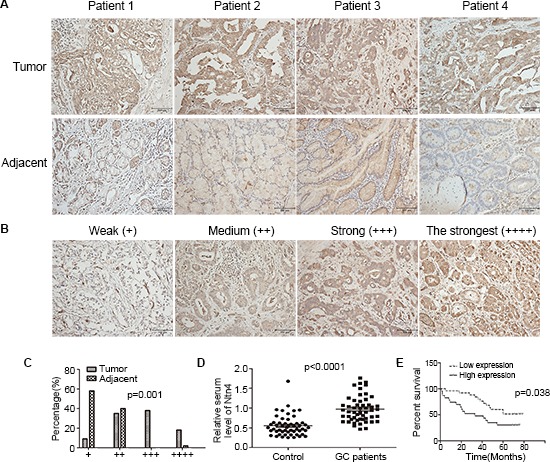
Figure 7. Ntn4 was overexpressed in GCs and negatively correlated with patient survival.

A. IHC staining of human GC tissues using Ntn4-specific antibody, as described in Methods; Magnification, × 200. B–C. Classification of samples according to the intensity of staining of Ntn4 expression (n = 82, p = 0.001). D. ELISA analysis to determine serum level of Ntn4 in GC patients and normal controls (n = 52, p < 0.001). E. Kaplan-Meier curves for GC patients' overall survival in the patients with high Ntn4 expression and low Ntn4 expression (n = 48, p = 0.038).
