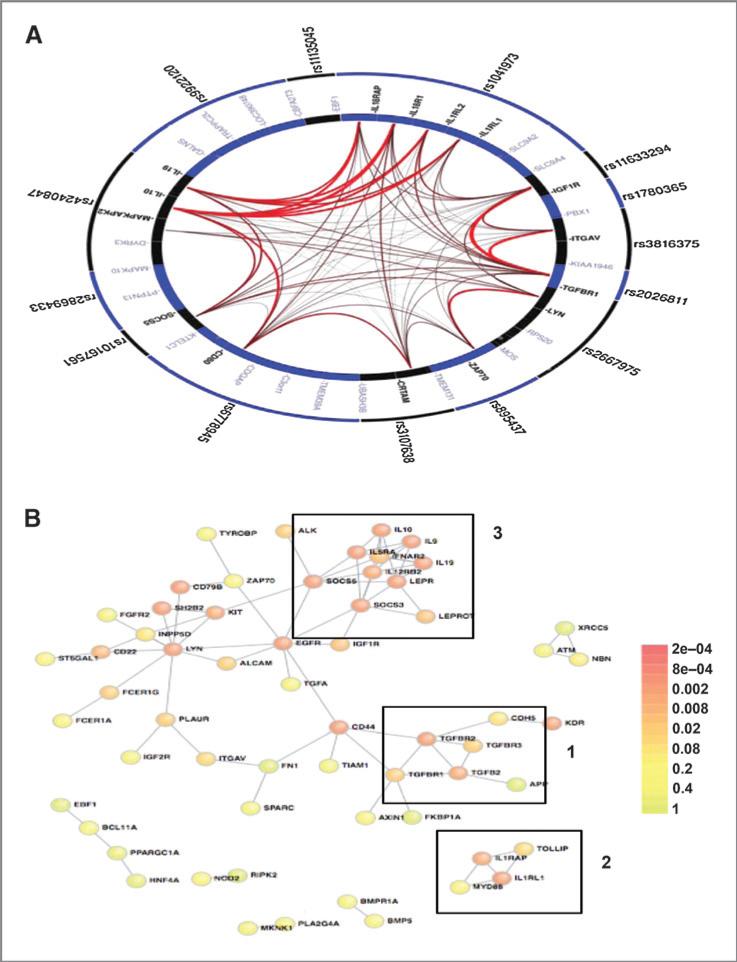
Figure 2.
Literature-based connectivity analyses. A, GGI analysis demonstrates the high degree of significant connectivity amongst the highly ranked immune SNPs in the oropharyngeal cancer GWAS. The figure was generated using the GRAIL platform, which determined the corresponding corrected P values for all gene–gene connections. The outer ring contains the input SNPs and the inner ring shows all possible genes corresponding to each SNP locus. Genes with significant intergene connections, determined by the GRAIL P value (Supplementary Table S2), are in bold and the thickness of the connection corresponds to strength of their interconnections. B, PPI network for the top ranked 200 immune genes in the oropharyngeal cancer GWAS generated using the DAPPLE platform. Nodes, proteins; links, direct interactions reported in the literature; colors, significance of the interaction as defined by the color key. Visual analysis of the oropharyngeal cancer GWAS immune network reveals three distinct immune clusters: 1, TGFβ signaling; 2, innate immunity; 3, Th1/Th2 balance.

