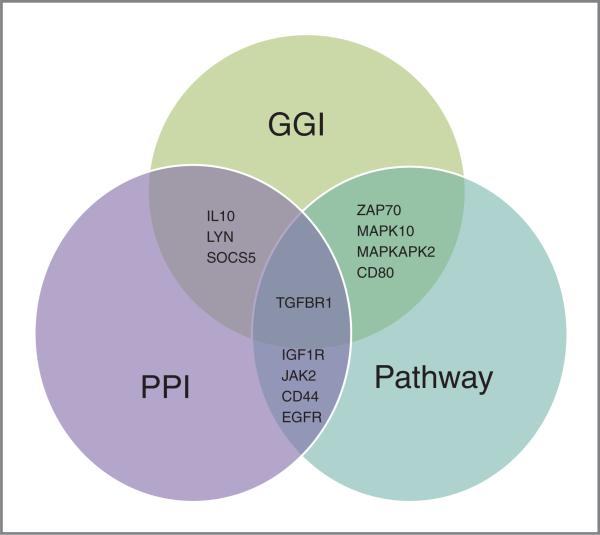
Figure 3.
The intersections of the integrative analysis. The results of each mode of analysis are listed in the Venn diagram. Multiple genes were found to overlap the results of two analyses but only TGFβR1 intersected the results of all three independent analyses. (Single-gene analysis was not included in this diagram as results informed the GGI analysis and thus would be redundant).

